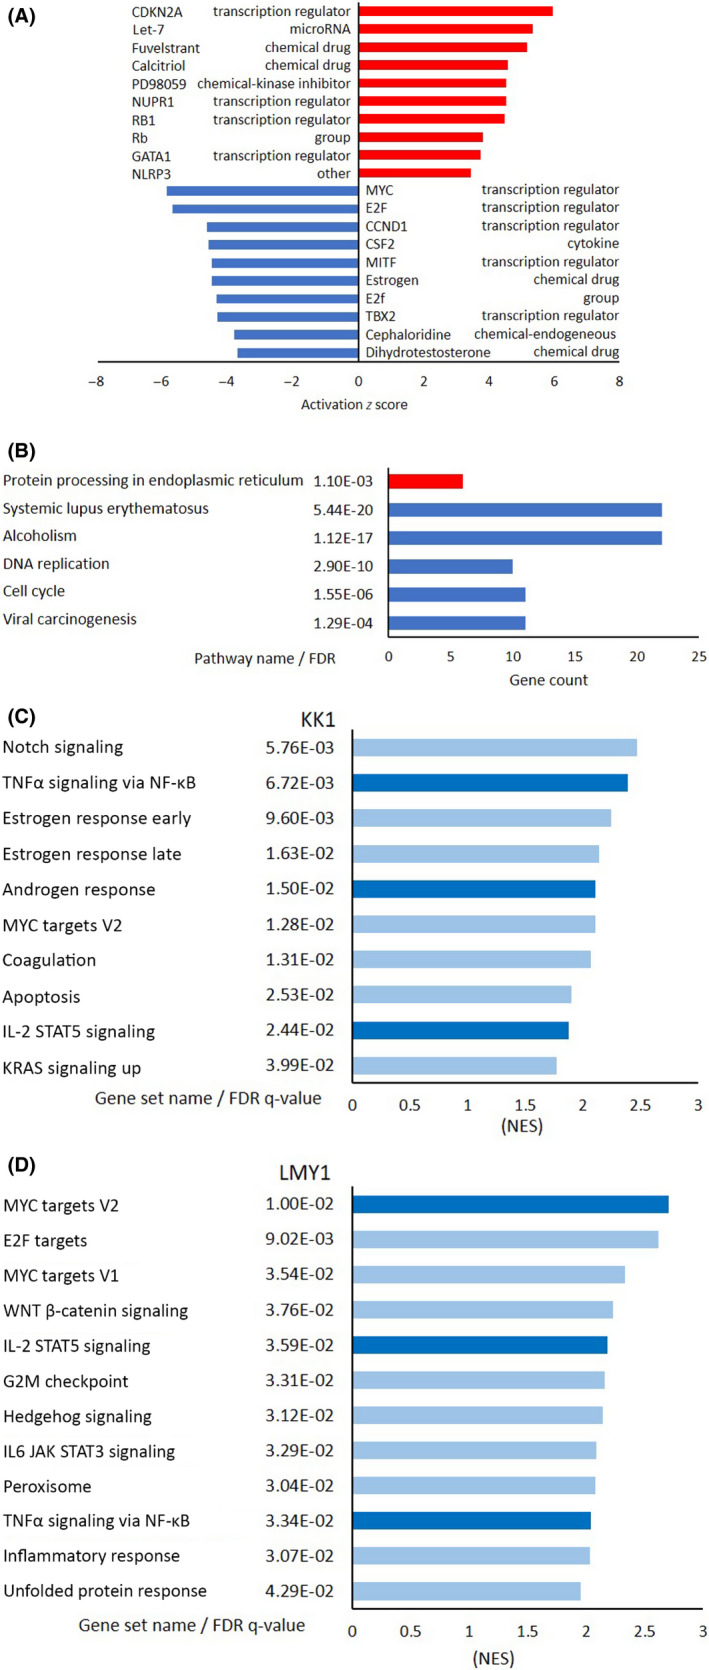
FIGURE 5.

Microarray and pathway analyses of Tax‐negative adult T‐cell leukemia/lymphoma cell lines. A, Ingenuity Pathway Analysis of Tax‐negative cells (ED‐40515 and Su9T01). Top 10 activated upstream regulators in Tax‐negative cells and their functions are shown according to activation z score. Red bars, increased; blue bars, decreased. B, Kyoto Encyclopedia of Genes and Genomes pathway analysis of Tax‐negative cells. Top 10 common pathways with low false discovery rate (FDR) values (<0.01) in Tax‐negative cells, along with their gene count, according to their FDR. Red bars, upregulated; blue bars, downregulated. C, D, Gene Set Enrichment Analysis of Tax‐negative KK1 and LMY1 cells. Top 10 downregulated gene sets, along with their FDR values, are shown according to the normalized enrichment score. Light blue bars, downregulated; dark blue bars, commonly downregulated gene sets in KK1 and LMY1. CCND1, Cyclin D1; CDKN2A, cyclin‐dependent kinase inhibitor 2A; CSF2, Colony‐stimulating factor 2; GATA1, GATA‐binding factor 1; IL, interleukin; NLRP3, Nod‐like receptor family pyrin domain containing 3; NUPR1, Nuclear Protein 1; Rb, RB transcriptional corepressor 1; TBX2, T‐box transcription factor 2; TNFα, tumor necrosis factor α
