
FIGURE 6.
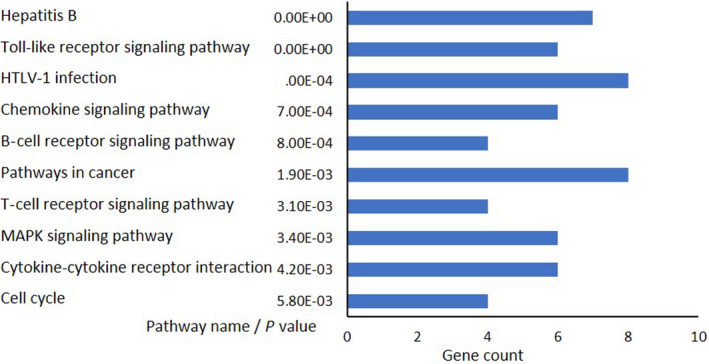
Microarray and pathway analyses of three primary adult T‐cell leukemia/lymphoma cells. Kyoto Encyclopedia of Genes and Genomes pathway analysis. Top 10 downregulated pathways, along with their gene count, are shown according to the P value. Blue bars, downregulated. HTLV‐1, human T‐cell leukemia virus type 1