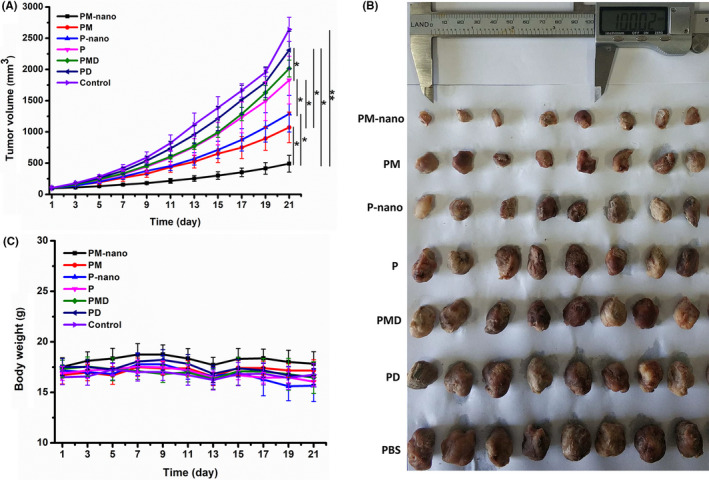
FIGURE 6.

Inhibition of tumor growth in vivo. A, Tumor volumes of mice during the whole experiment. B, Body weights of 4T1 tumor‐bearing mice. C, Photographs of excised tumors on day 21 after treatment. *P < .05, **P < .01. P, paclitaxel; PD, paclitaxel + dexamethasone; PM, paclitaxel + mifepristone; PMD, paclitaxel + mifepristone + dexamethasone; PM‐nano, paclitaxel‐conjugated and mifepristone‐loaded supramolecular hydrogel; P‐nano, paclitaxel hydrogel
