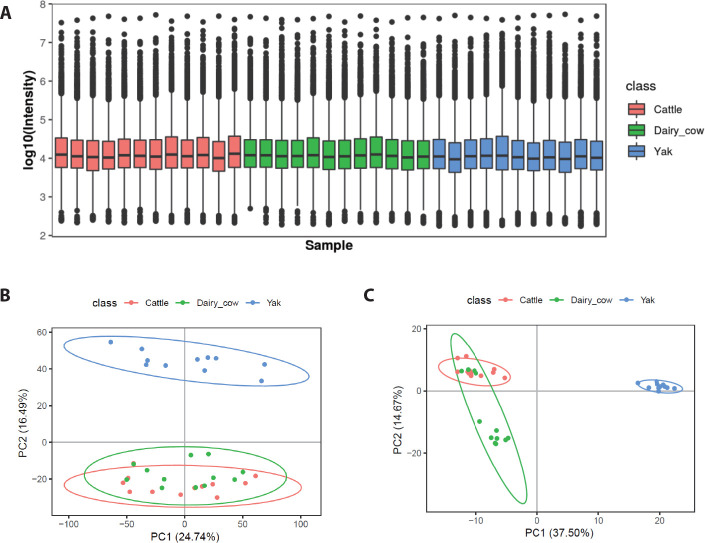
Fig. 2. Comparison of distribution of serum metabolite levels among yak, dairy cow and yellow cattle.
(A) Box plots represent the distribution of metabolite peak intensity measurements from serum samples across all subjects. PCA scores plots of serum metabolomic profiles derived from UPLC-Q-TOF-MS spectra showing separation between yak and yellow cattle and dairy cow in the positive mode (B) and negative mode (C). PC, principal component; PCA, principal component analysis; UPLC-Q-TOF-MS, ultra-performance liquid chromatography-quadrupole time-of-flight mass spectrometry.

