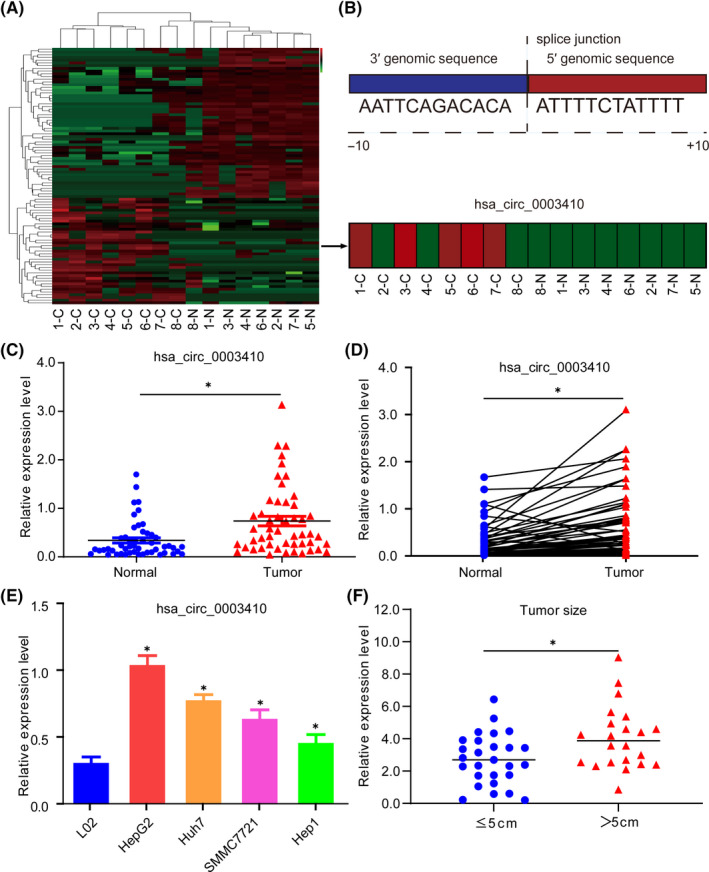
FIGURE 1.

High expression of hsa_circ_0003410 in HCC and its correlation with clinical features. A, Expression profile of noncoding RNA in 8 paired HCC tissues by high‐throughput sequencing. B, Splice junction sequence of hsa_circ_0003410 and its expression in 8 paired HCC tissues. C, D, Relative expression levels of hsa_circ_0003410 in 50 paired HCC tissues. E, Relative expression levels of hsa_circ_0003410 in HCC cell lines. F, Relationship between hsa_circ_0003410 expression and tumor size
