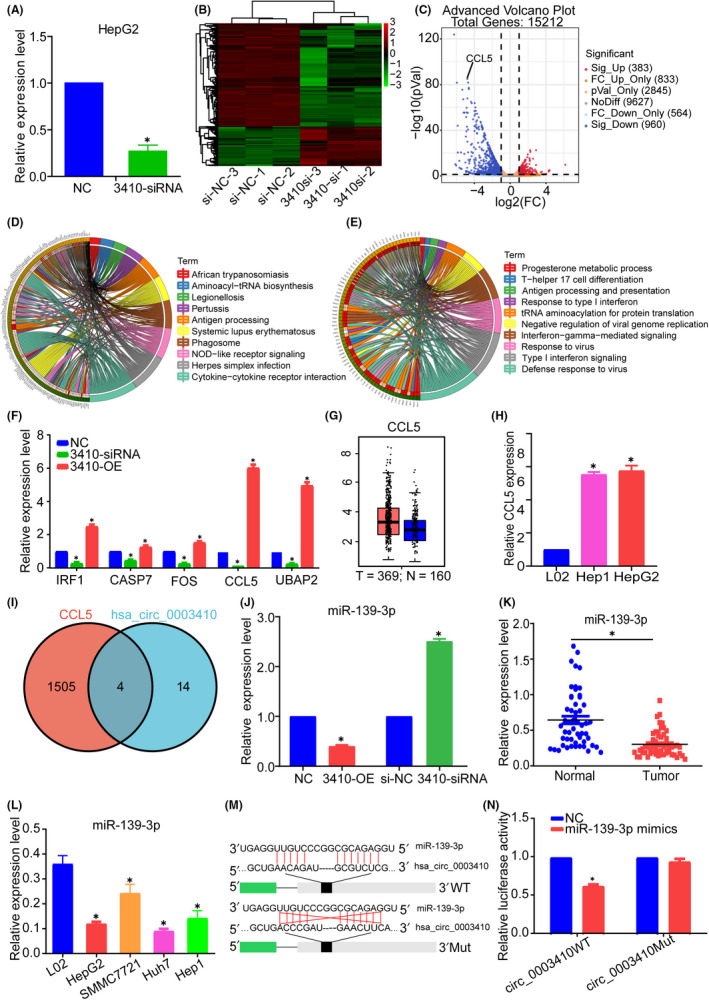
FIGURE 3.

Identification of hsa_circ_0003410 target gene CCL5 by next‐generation sequencing and determination of miR‐139‐3p. A, KO efficiency verification of sequencing cells. B, C, Heatmap and volcanic plot of differentially expressed genes between si‐NC and 3410‐si groups. D, E, KEGG and GO enrichment analysis of differentially expressed genes. F, Expression changes in key genes after hsa_circ_0003410 overexpression or KO. G, CCL5 expression in TCGA database. H, CCL5 expression in HCC cell lines. I, Venn diagram of common miRNA prediction of CCL5 and hsa_circ_0003410. J, Relative expression of miR‐139‐3p after hsa_circ_0003410 overexpression or KO. K, L, miR‐139‐3p expression levels in HCC tissues and cell lines. M, N, Dual‐Luciferase Reporter Assay verification of the combination of hsa_circ_0003410 and miR‐139‐3p
