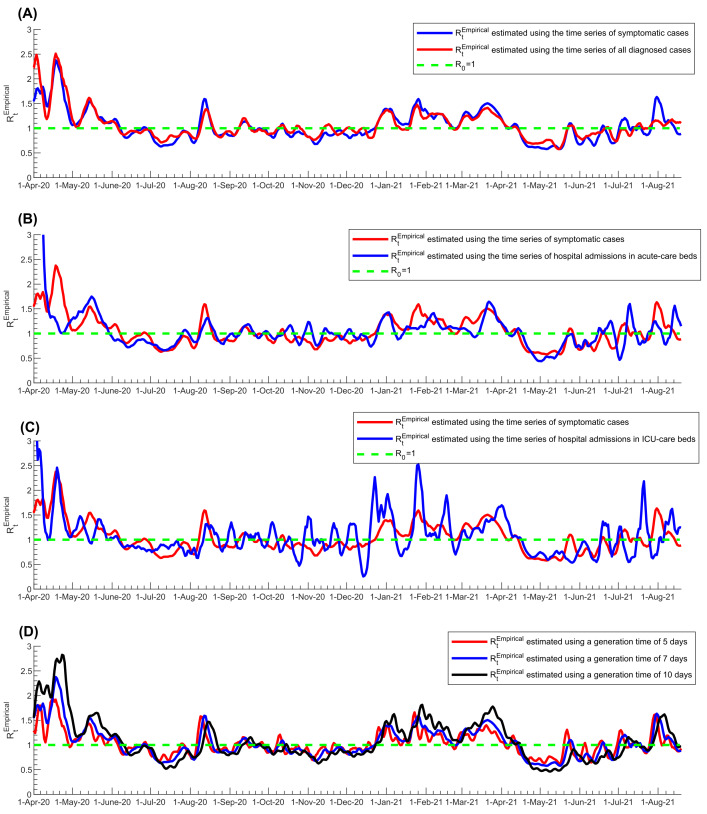
Figure 2.
Sensitivity analyses of estimated RtEmpirical using the Robert Koch Institute method. A) Sensitivity analysis using the time series of all diagnosed cases instead of only symptomatic cases in estimating RtEmpirical. B) Sensitivity analysis using the time series of hospital admissions in acute-care beds instead of symptomatic cases in estimating RtEmpirical. C) Sensitivity analysis using the time series of hospital admissions in ICU-care beds instead of symptomatic cases in estimating RtEmpirical. D) Sensitivity analysis using different values for the generation time in estimating RtEmpirical. The dashed green line represents the threshold of R0 = 1.

