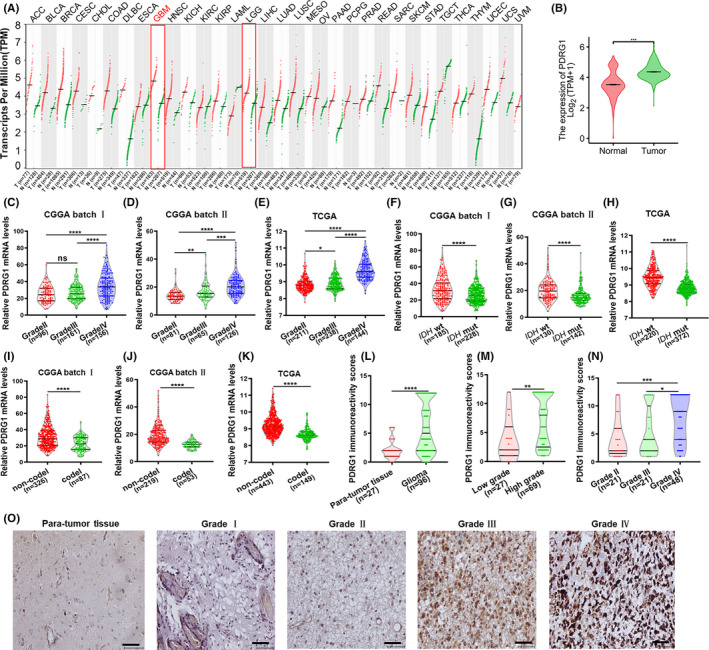
FIGURE 1.

PDRG1 was aberrantly overexpressed in GBM. A, The dot plot shows the gene expression profile across all tumor samples and paired normal tissues from the Gene Expression Profiling Interactive Analysis web server. B, PDRG1 mRNA levels were analyzed in gliomas and normal brain tissue from TCGA database (n = 703), GTEx database (n = 1152), CGGA database batch I (C), CGGA batch Ⅱ (D), and TCGA database (E). PDRG1 expression in different IDH genotype of gliomas from CGGA batch (F, G) and TCGA database (H). PDRG1 expression in different 1p/19q status of glioma from CGGA (I, J) and TCGA database (K). L, PDRG1 immunoreactivity was scored and analyzed in human para‐tumor tissue and glioma tissue groups. M, PDRG1 immunoreactivity score was statistically analyzed in low‐grade and high‐grade glioma tissues. N, PDRG1 immunoreactivity score was statistically analyzed in grade Ⅱ, grade Ⅲ, and grade Ⅳ glioma tissues. O, Representative IHC images of PDRG1 in human para‐tumor tissue and glioma tissues. Scale bars, 50 μm. Error bars, SD
