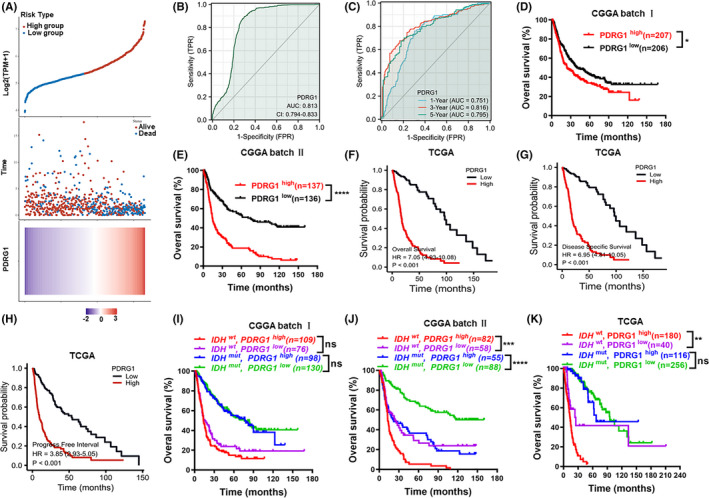
FIGURE 2.

PDRG1 is a negative prognosticator for survival in glioma. A, Risk score distribution, survival overview, and heatmap for patients in TCGA cohorts assigned to high‐ and low‐risk groups based on the risk score. B, ROC curve of PDRG1 expression in the glioma cohort. C, Timed dependent ROC curve of PDRG1 expression in the glioma cohort. Overall survival analysis in datasets from CGGA and TCGA databases (D‐F). High levels of PDRG1 mRNA are associated with the poor prognosis of patients. Disease‐specific survival analysis (G) and progress‐free intervals (H) in datasets from TCGA database. Survival analysis of PDRG1 mRNA expression and IDH gene status in CGGA and TCGA databases (I‐K). Error bars, SD
