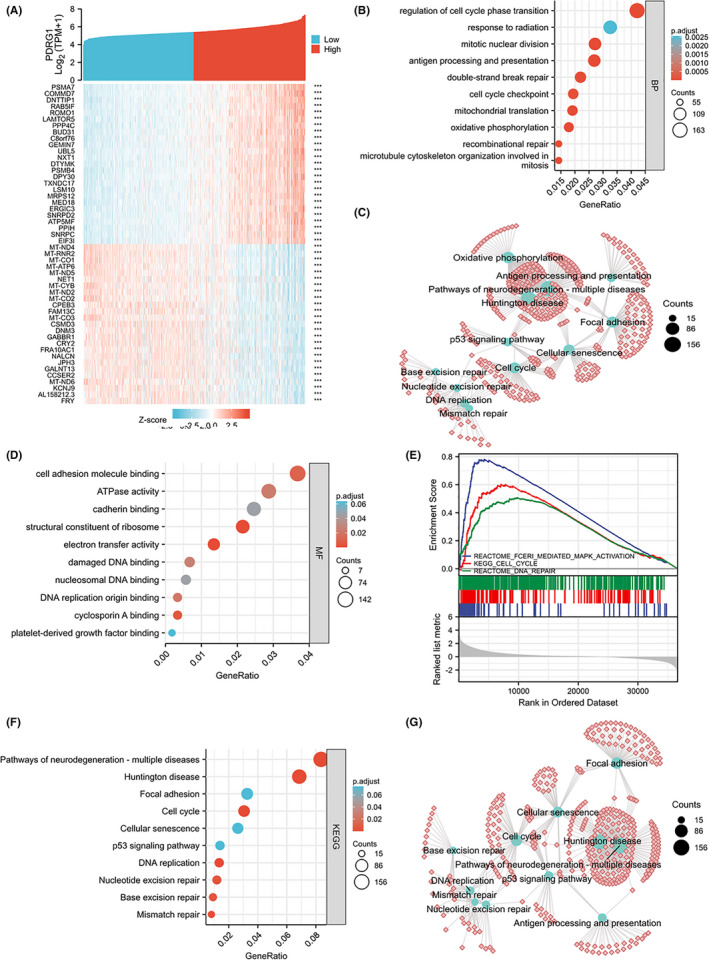
FIGURE 4.

GO, KEGG, and GSEA analysis of PDRG1 in TCGA data. A, The top 25 genes most positively or negatively associated with PDRG1 are shown on a heatmap. B, C, GO enrichment analysis (biological process) of PDRG1 and its co‐expression genes. The GO enriched terms are colored by P value. D, GO enrichment analysis (molecular function) of PDRG1 and its co‐expression genes. GSEA (E) and KEGG pathway enrichment (F, G) analyses were performed
