FIGURE 9.

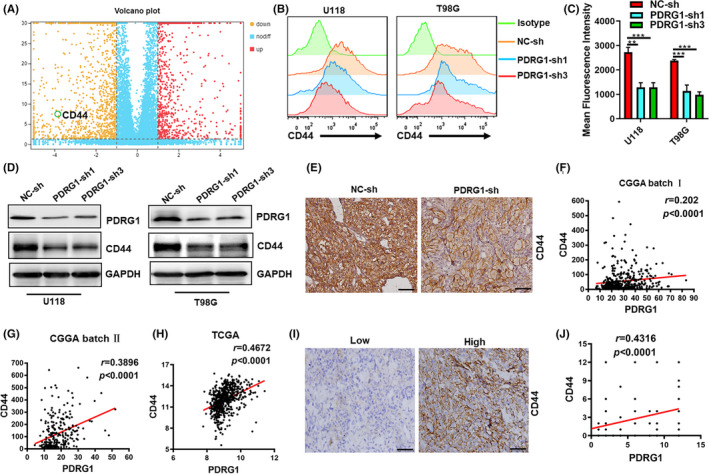
Expression of adhesion molecule CD44 was regulated by PDRG1 in GBM cells. A, Volcano plots show the difference analyses of gene expression between the normal and PDRG1 knockdown groups. Red and yellow points represent up‐ and downregulated genes, respectively. Blue points represent genes with no differently expressing. B, C, The surface expression of CD44 in negative control and PDRG1 knockdown U118 cells and T98G cells was measured by flow cytometry. D, Western blot analysis of the level of CD44 in PDRG1 silenced U118 and T98G cells. E, Luciferase‐labeled U118 cells were used to establish the intracranial glioma model. Representative IHC images of the intracranial glioma tissue stained by CD44. Scale bar, 50 μm. Correlation analysis was performed between PDRG1 and CD44 mRNA level in CGGA (F‐G) and TCGA (H) dataset. I, Immunohistochemistry analyzed the CD44 expression in PDRG1‐high and PDRG1‐low glioma specimens. Scale bar, 50 μm. J, Correlation analysis of the immunostaining scores of PDRG1 with CD44 in human glioma specimens
