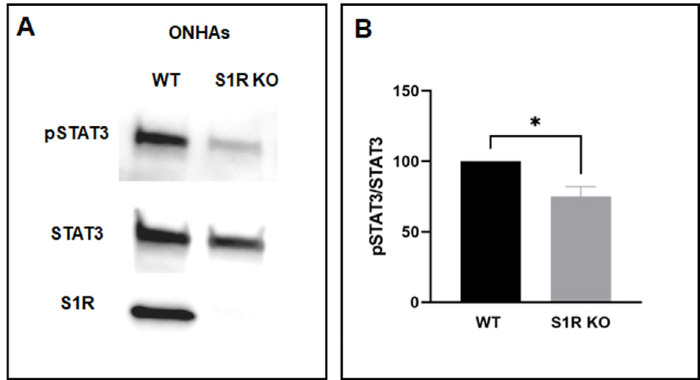
Figure 8.
pSTAT3 and STAT3 expression in WT or S1R KO ONHAs cells. (A) Representative Western blot showing decreased phosphorylation of STAT3 in S1R KO ONHAs compare to WT ONHAs. (B) Quantitative analysis by ImageJ. Significantly different from control at *P < 0.05. Data were analyzed using the Student t test. These experiments were repeated in triplicate with cells isolated from different dates, different animals.

