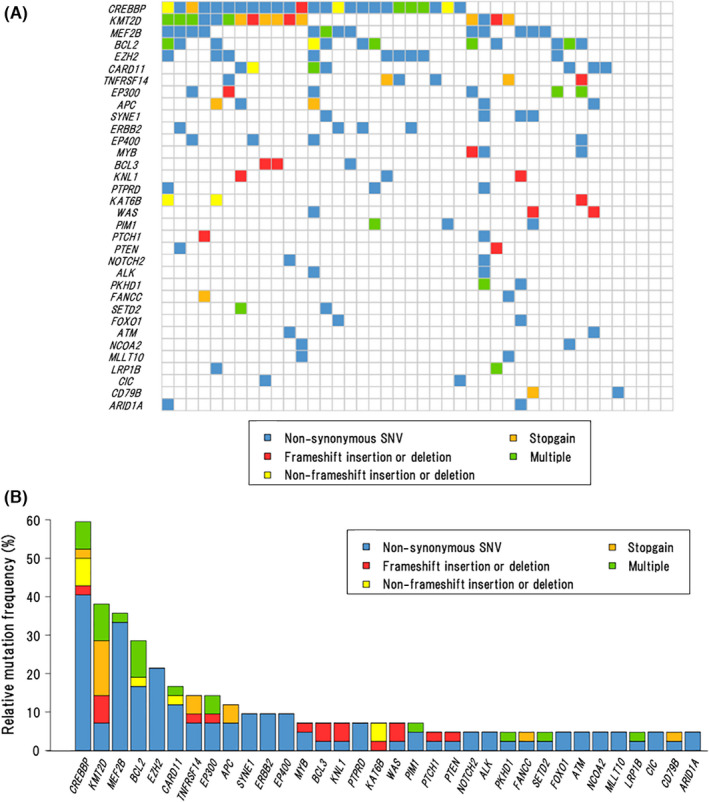
FIGURE 1.

Landscape of somatic mutations. A, Co‐mutation plot showing the spectrum of recurrently mutated genes across all cases (n = 42). B, Frequencies and types of somatic mutations in 34 recurrently mutated genes (found in ≥2 cases) for all cases (n = 42)
