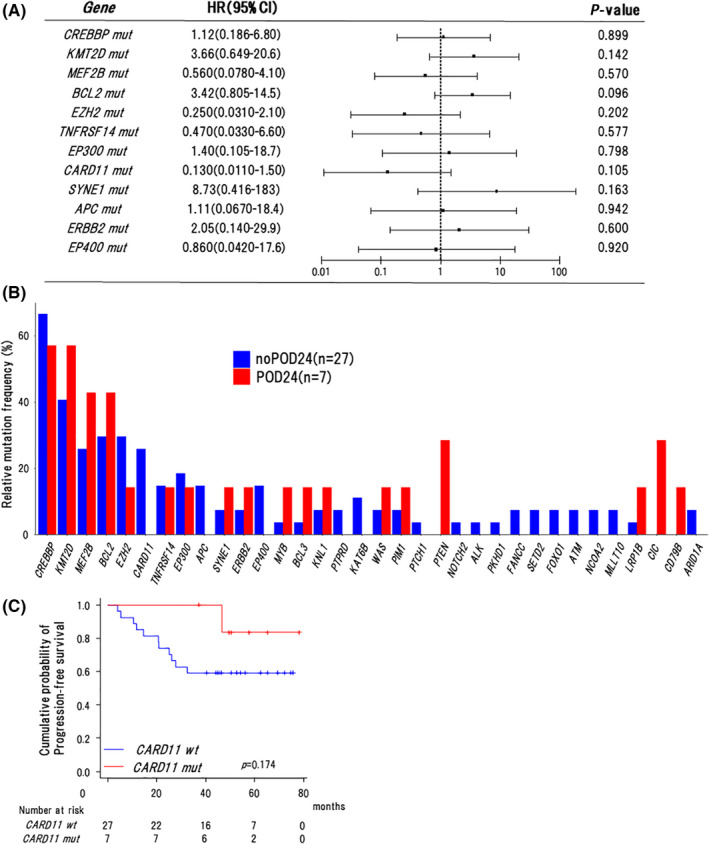
FIGURE 2.

Association of mutation profile with clinical outcomes in the nOR group. A, Forest plot for progression‐free survival in univariate analyses. HR, hazard ratio. Mut, mutations. B, Frequencies of mutations in 34 recurrently mutated genes in cases with or without POD24 in the nOR group (n = 34). C, Kaplan‐Meier curves for progression‐free survival of cases with or without CARD11 mutations in the nOR group (n = 34). Log‐rank P‐values are shown in the graphs. Wt, wild type. Mut, mutations
