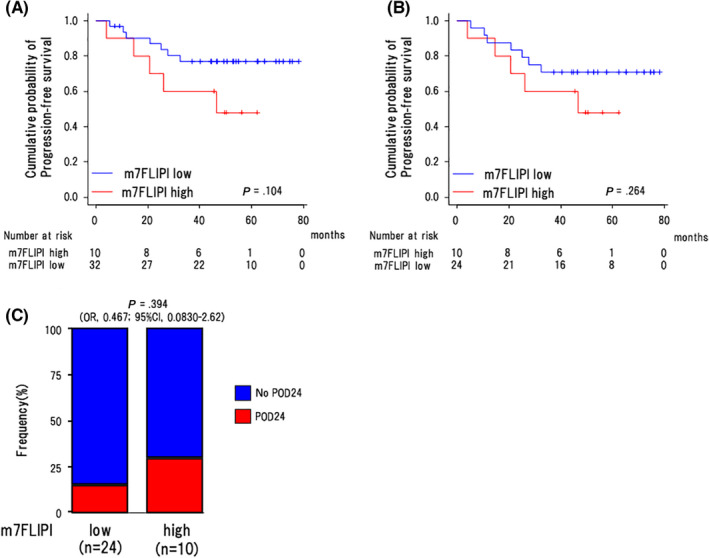
FIGURE 3.

Association of m7‐FLIPI with clinical outcomes. Comparison of progression‐free survival between the cases in the low‐risk and high‐risk categories classified by m7‐FLIPI for (A) all cases (n = 42) and (B) nOR group (n = 34). Log‐rank P‐values are shown in the graphs. Int, intermediate. C, The proportions of the low‐risk and high‐risk categories classified by m7‐FLIPI in the cases with and without POD24 in the nOR group (n = 34). P‐values by Fisher exact test are shown in the graphs
