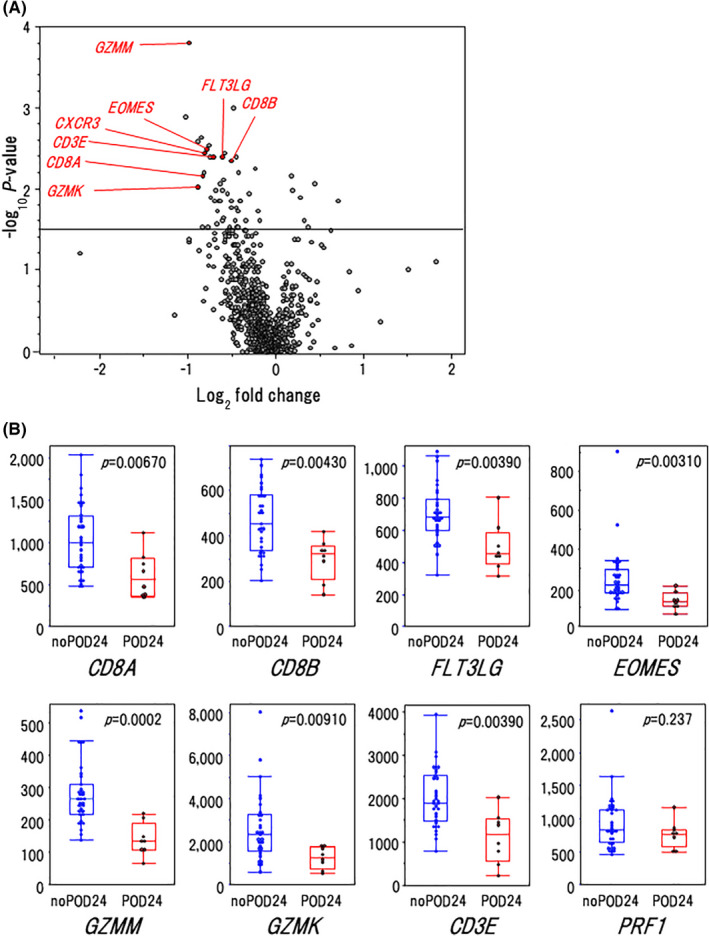
FIGURE 5.

Association of T‐cell‐associated gene expression with clinical outcomes. A, Volcano plot indicating differentially expressed genes in cases with or without POD24 in the nOR group (n = 39). B, Gene expression levels of the CD8+ T‐cell markers in the cases with POD24 and without POD24. P‐values by Fisher exact test are shown in the graphs. In the box plots, the center line and lower and upper hinges correspond to the median, and the first and third quartiles (25 and 75 percentiles), respectively. The upper and lower whiskers extend from the upper and lower hinges to the largest or smallest values no further than a 1.5× inter‐quartile range from the hinges
