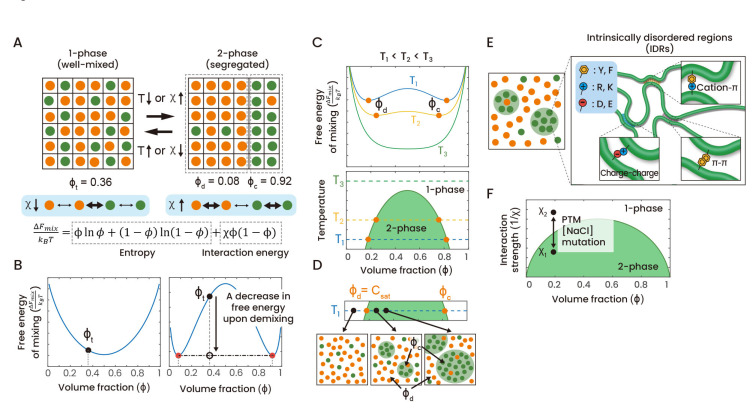
Fig. 1. Binary regular solution model and its phase behaviors.
(A) A binary regular solution model. In the binary system, two types of species, a solute and a solvent, are distributed in each lattice site. The volume fraction of solutes, φ, serves as an important parameter for describing the state of the system. When the system undergoes phase separation into the two-phase state, the system volume is divided into two regions with different volume fractions of solutes. As an example, this figure shows a transition between the single-phase state with a total solute volume fraction, φt, and the two-phase state with volume fractions φd and φc. Interactions between species are characterized by the Flory interaction parameter, χ. When homotypic interactions are favored over heterotypic ones, phase separation can be induced. The free energy of mixing per unit volume, ΔFmix, is given by the sum of entropic contribution and interaction energies. (B) (Left) In the absence of any interactions between species (χ = 0), the compositional dependence of the free energy is convex, leading to the well-mixed single-phase state. (Right) When homotypic interactions are strong enough, the free energy curve becomes concave, and the system can lower the free energy by dividing the system volume into two regions with differing compositions. The solid and empty black circles denote the total free energy of the system before and after phase separation, respectively. Red circles represent solute volume fractions in the dilute and dense phases. (C) Temperature dependence of the free energy and the resulting phase diagram. (Top) For each temperature, the free energy curve determines whether phase separation occurs or not and, if it occurs, volume fractions in two phases (φd and φc) as well. (Bottom) Phase diagrams are typically drawn in the temperature-volume fraction (concentration) plane. (D) In the binary regular solution model, at constant temperature, increasing solute concentration increases the volume of the dense phase while the solute concentrations in two coexisting-phases are fixed to values at the phase boundary. Frequently, a concentration corresponding to the left-hand side boundary of the coexistence region is called the saturation concentration, Csat. (E) Proteins containing intrinsically disordered regions can often phase-separate through homotypic IDR-IDR interactions mediated by charged and/or aromatic residues. (F) The phase diagram of the binary regular solution model can also be plotted in the concentration-interaction parameter plane. Changes in interaction strengths, caused by perturbations such as post-translational modifications, mutations, and varying salt concentrations, can modulate phase separation behavior.

