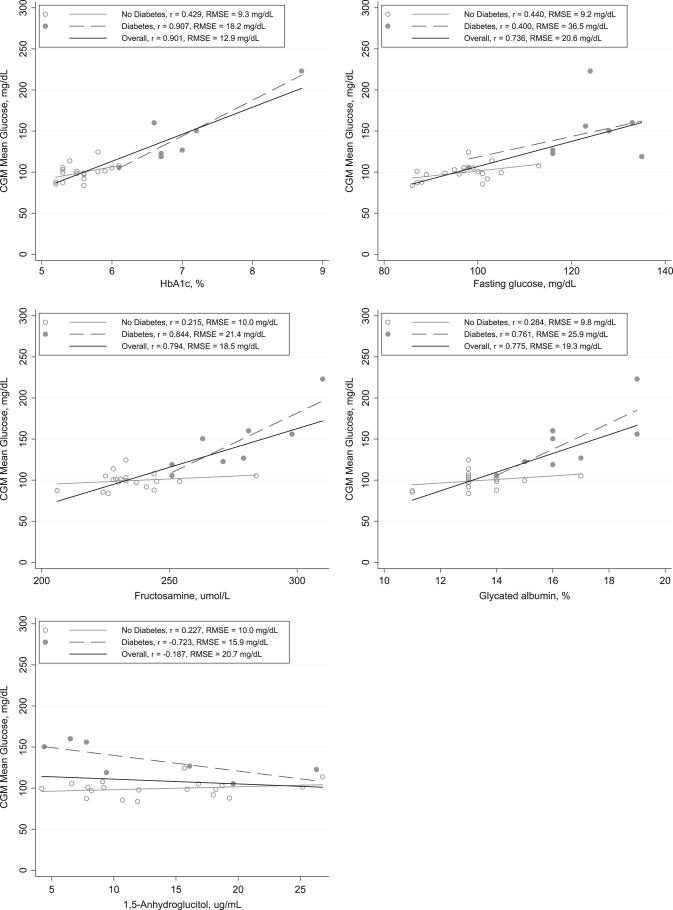
FIG. 3.
Scatterplots of mean glucose with HbA1c, fasting glucose, fructosamine, glycated albumin, and 1,5-AG. Lines are from linear regression models in the overall study population (solid black line) and in persons with diabetes (dotted line) and without diabetes (solid gray line). 1,5-AG, 1,5-anhydroglucitol; HbA1c, hemoglobin A1c.

