Figure 6.
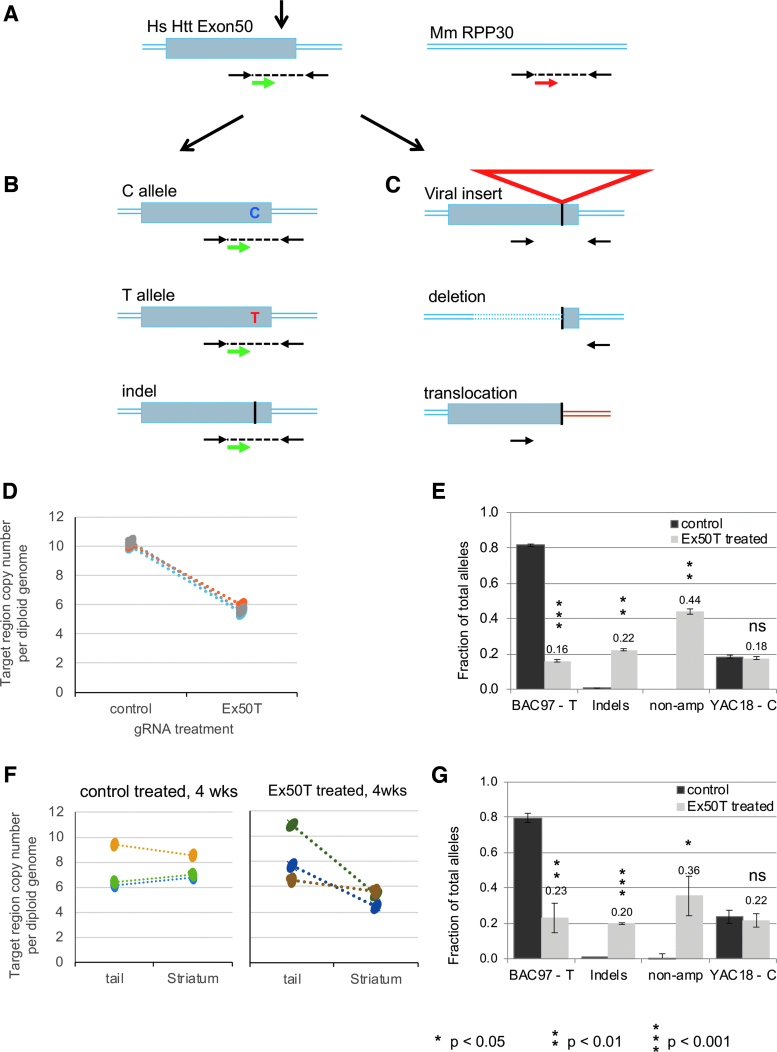
Analysis of nonamplified mutations by ddPCR. (A) The relative copy number of human exon 50 was measured using primers (black arrows) and a probe (green arrow) flanking the CRISPR-Cas9 target site. A second set of primers and probe (red arrow) were used to determine the copy number of a reference locus, the mouse RPP30 gene. (B) After DNA cleavage and repair, ddPCR detects chromosomes with either of the original SNP allele sequences or small InDel alleles. (C) ddPCR does not detect chromosomes with mutations that either remove (large deletions) or separate (translations or large insertions) the primer binding sites. (D) ddPCR was used to determine the total copy number of transgenic human HTT exon 50 in the primary neurons using the mouse RPP30 as a reference for the diploid genome. Samples were treated with lentivirus expressing Ex50T gRNA or a control (Rosa26) gRNA. Exon 50 copy number was decreased from an average of 10.2 to 5.7 across three paired neuronal samples. The 44% reduction reflects alleles that can no longer be amplified using the primers for allele sequencing. (E) The fraction of each allele class is estimated by multiplying the fraction of sequenced alleles by the estimated fraction of alleles that could be amplified (0.56) based on the ddPCR results. “non-amp” indicates the estimated fraction of alleles that could not be amplified. (F) ddPCR was used to determine the total copy number of human HTT exon 50 in the 4-week striatal samples treated with AAV expressing the Ex50T or a control (Rosa26) gRNA and in untreated tail DNA from the same animals. There was no significant difference in the exon 50 copy number between tails and striatum treated with the control gRNA. In contrast, the copy number was reduced by an average of 36% in striatum treated with the Ex50T gRNA. This reduction reflects alleles that can no longer be amplified using the primers for allele sequencing. (G) The fraction of each allele class is estimated by multiplying the fraction of sequenced alleles by the estimated fraction of alleles that could be amplified (0.64) based on the ddPCR results. “non-amp” indicates the estimated fraction of alleles that could not be amplified. n = 3 mice and error bars represent the SEM. p-values <0.05 were considered significant. Exact p-values are reported in Supplementary File 3. ddPCR, droplet digital PCR. Color images are available online.

