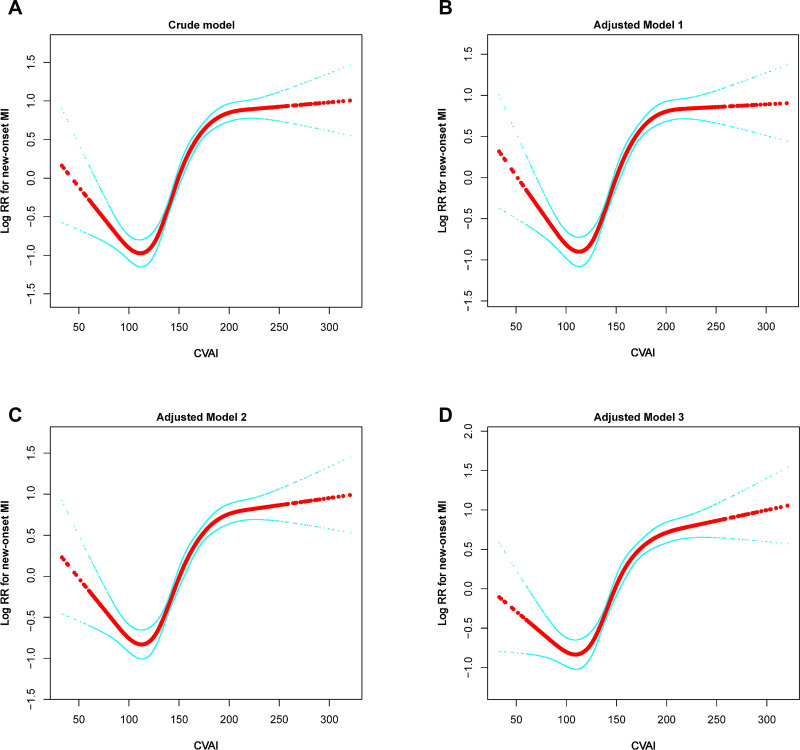
Figure 3.
Dose-response relationship between CVAI and the probability of new-onset MI in different multivariable models. (A) crude model, (B) adjusted model 1, (C) adjusted model 2, and (D) adjusted model 3. Red line represents the smooth curve fit between variables. Blue line represents the 95% of confidence interval from the fit. Crude model: Unadjusted. Adjusted model 1: Adjusted for age, gender, NC, BMI, DBP, SBP, history of diabetes, drinking status, smoking status, and the time lag between baseline and follow-up. Adjusted model 2: Adjusted for all the variables in model 1, plus TG, TC, LDL-C, HDL-C, Lp (a), FPG, HsCRP, Hcy, and the time lag between baseline and follow-up. Adjusted model 3: Adjusted for all the variables in model 2, plus antihypertensive drugs, lipid-lowering drugs, antiplatelet drugs, antidiabetic drugs, regular CPAP treatment, AHI, mean SaO2, lowest SaO2, and the time lag between baseline and follow-up.
Abbreviations: MI, myocardial infarction; RR, relative risk; other abbreviations in Table 1.

