FIGURE 5.
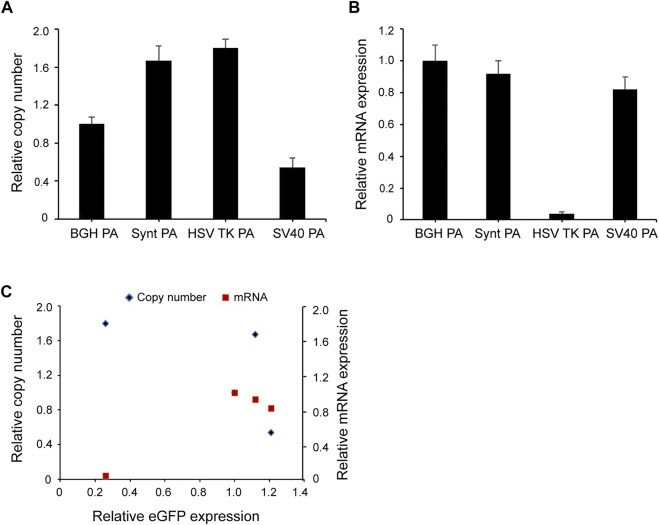
(A,B) Relative eGFP copy number and mRNA expression level in long-term stable transfected cells. Fluorescent quantitative PCR was used to analyze eGFP gene copy numbers and mRNA expression. Relative copy numbers and mRNA expression levels were calculated using the 2−ΔΔCt method and were normalized to the BGH poly A vector whose value was set to 1. (C) Correlation analysis between the relative eGFP copy (blue diamond), mRNA expression (red square) and relative eGFP expression in long-term stable transfected CHO cells. Results were obtained from three independent experiments. The standard error of the mean (S.E.M.) was indicated.

