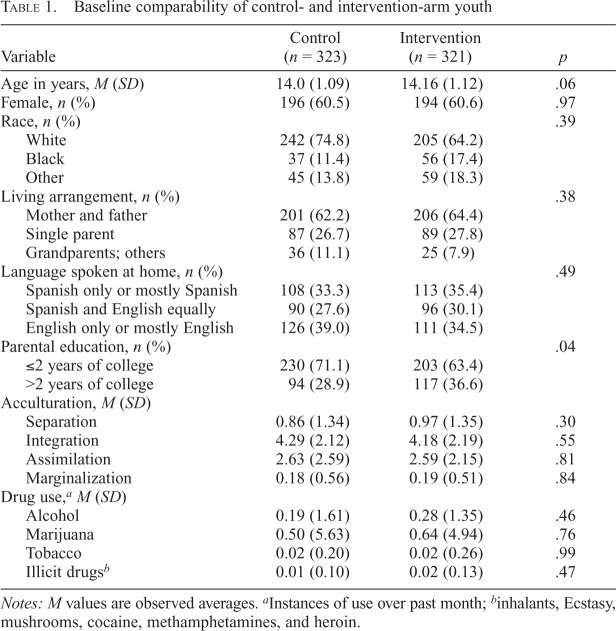
Table 1.
Baseline comparability of control- and intervention-arm youth
| Variable | Control (n = 323) | Intervention (n = 321) | p |
|---|---|---|---|
| Age in years, M (SD) | 14.0 (1.09) | 14.16 (1.12) | .06 |
| Female, n (%) | 196 (60.5) | 194 (60.6) | .97 |
| Race, n (%) | .39 | ||
| White | 242 (74.8) | 205 (64.2) | |
| Black | 37 (11.4) | 56 (17.4) | |
| Other | 45 (13.8) | 59 (18.3) | |
| Living arrangement, n (%) | .38 | ||
| Mother and father | 201 (62.2) | 206 (64.4) | |
| Single parent | 87 (26.7) | 89 (27.8) | |
| Grandparents; others | 36 (11.1) | 25 (7.9) | |
| Language spoken at home, n (%) | .49 | ||
| Spanish only or mostly Spanish | 108 (33.3) | 113 (35.4) | |
| Spanish and English equally | 90 (27.6) | 96 (30.1) | |
| English only or mostly English | 126 (39.0) | 111 (34.5) | |
| Parental education, n (%) | .04 | ||
| ≤2 years of college | 230 (71.1) | 203 (63.4) | |
| >2 years of college | 94 (28.9) | 117 (36.6) | |
| Acculturation, M (SD) | |||
| Separation | 0.86 (1.34) | 0.97 (1.35) | .30 |
| Integration | 4.29 (2.12) | 4.18 (2.19) | .55 |
| Assimilation | 2.63 (2.59) | 2.59 (2.15) | .81 |
| Marginalization | 0.18 (0.56) | 0.19 (0.51) | .84 |
| Drug use,aM (SD) | |||
| Alcohol | 0.19 (1.61) | 0.28 (1.35) | .46 |
| Marijuana | 0.50 (5.63) | 0.64 (4.94) | .76 |
| Tobacco | 0.02 (0.20) | 0.02 (0.26) | .99 |
| Illicit drugsb | 0.01 (0.10) | 0.02 (0.13) | .47 |
Notes: M values are observed averages.
Instances of use over past month;
inhalants, Ecstasy, mushrooms, cocaine, methamphetamines, and heroin.

