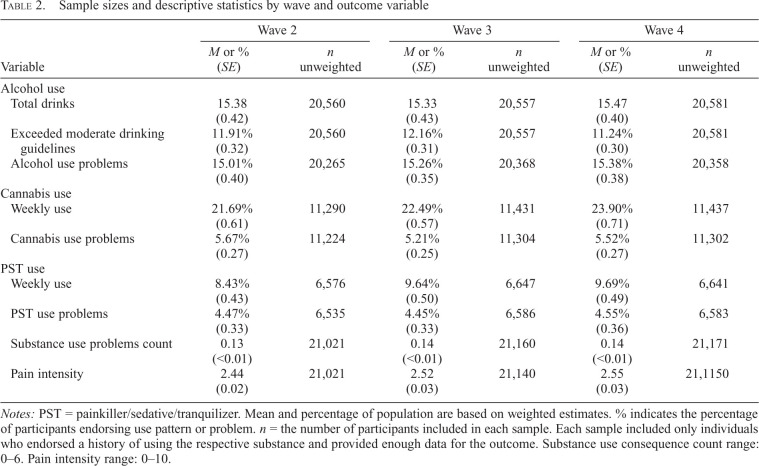
Table 2.
Sample sizes and descriptive statistics by wave and outcome variable
| Wave 2 | Wave 3 | Wave 4 | ||||
|---|---|---|---|---|---|---|
| Variable |
M or % (SE) |
n unweighted |
M or % (SE) |
n unweighted |
M or % (SE) |
n unweighted |
| Alcohol use | ||||||
| Total drinks | 15.38 (0.42) |
20,560 | 15.33 (0.43) |
20,557 | 15.47 (0.40) |
20,581 |
| Exceeded moderate drinking guidelines | 11.91% (0.32) |
20,560 | 12.16% (0.31) |
20,557 | 11.24% (0.30) |
20,581 |
| Alcohol use problems | 15.01% (0.40) |
20,265 | 15.26% (0.35) |
20,368 | 15.38% (0.38) |
20,358 |
| Cannabis use Weekly use | 21.69% (0.61) |
11,290 | 22.49% (0.57) |
11,431 | 23.90% (0.71) |
11,437 |
| Cannabis use problems | 5.67% (0.27) |
11,224 | 5.21% (0.25) |
11,304 | 5.52% (0.27) |
11,302 |
| PST use Weekly use | 8.43% (0.43) |
6,576 | 9.64% (0.50) |
6,647 | 9.69% (0.49) |
6,641 |
| PST use problems | 4.47% (0.33) |
6,535 | 4.45% (0.33) |
6,586 | 4.55% (0.36) |
6,583 |
| Substance use problems count | 0.13 (< 0.01) |
21,021 | 0.14 (< 0.01) |
21,160 | 0.14 (< 0.01) |
21,171 |
| Pain intensity | 2.44 (0.02) |
21,021 | 2.52 (0.03) |
21,140 | 2.55 (0.03) |
21,1150 |
Notes: PST = painkiller/sedative/tranquilizer. Mean and percentage of population are based on weighted estimates. % indicates the percentage of participants endorsing use pattern or problem. n = the number of participants included in each sample. Each sample included only individuals who endorsed a history of using the respective substance and provided enough data for the outcome. Substance use consequence count range: 0–6. Pain intensity range: 0–10.

