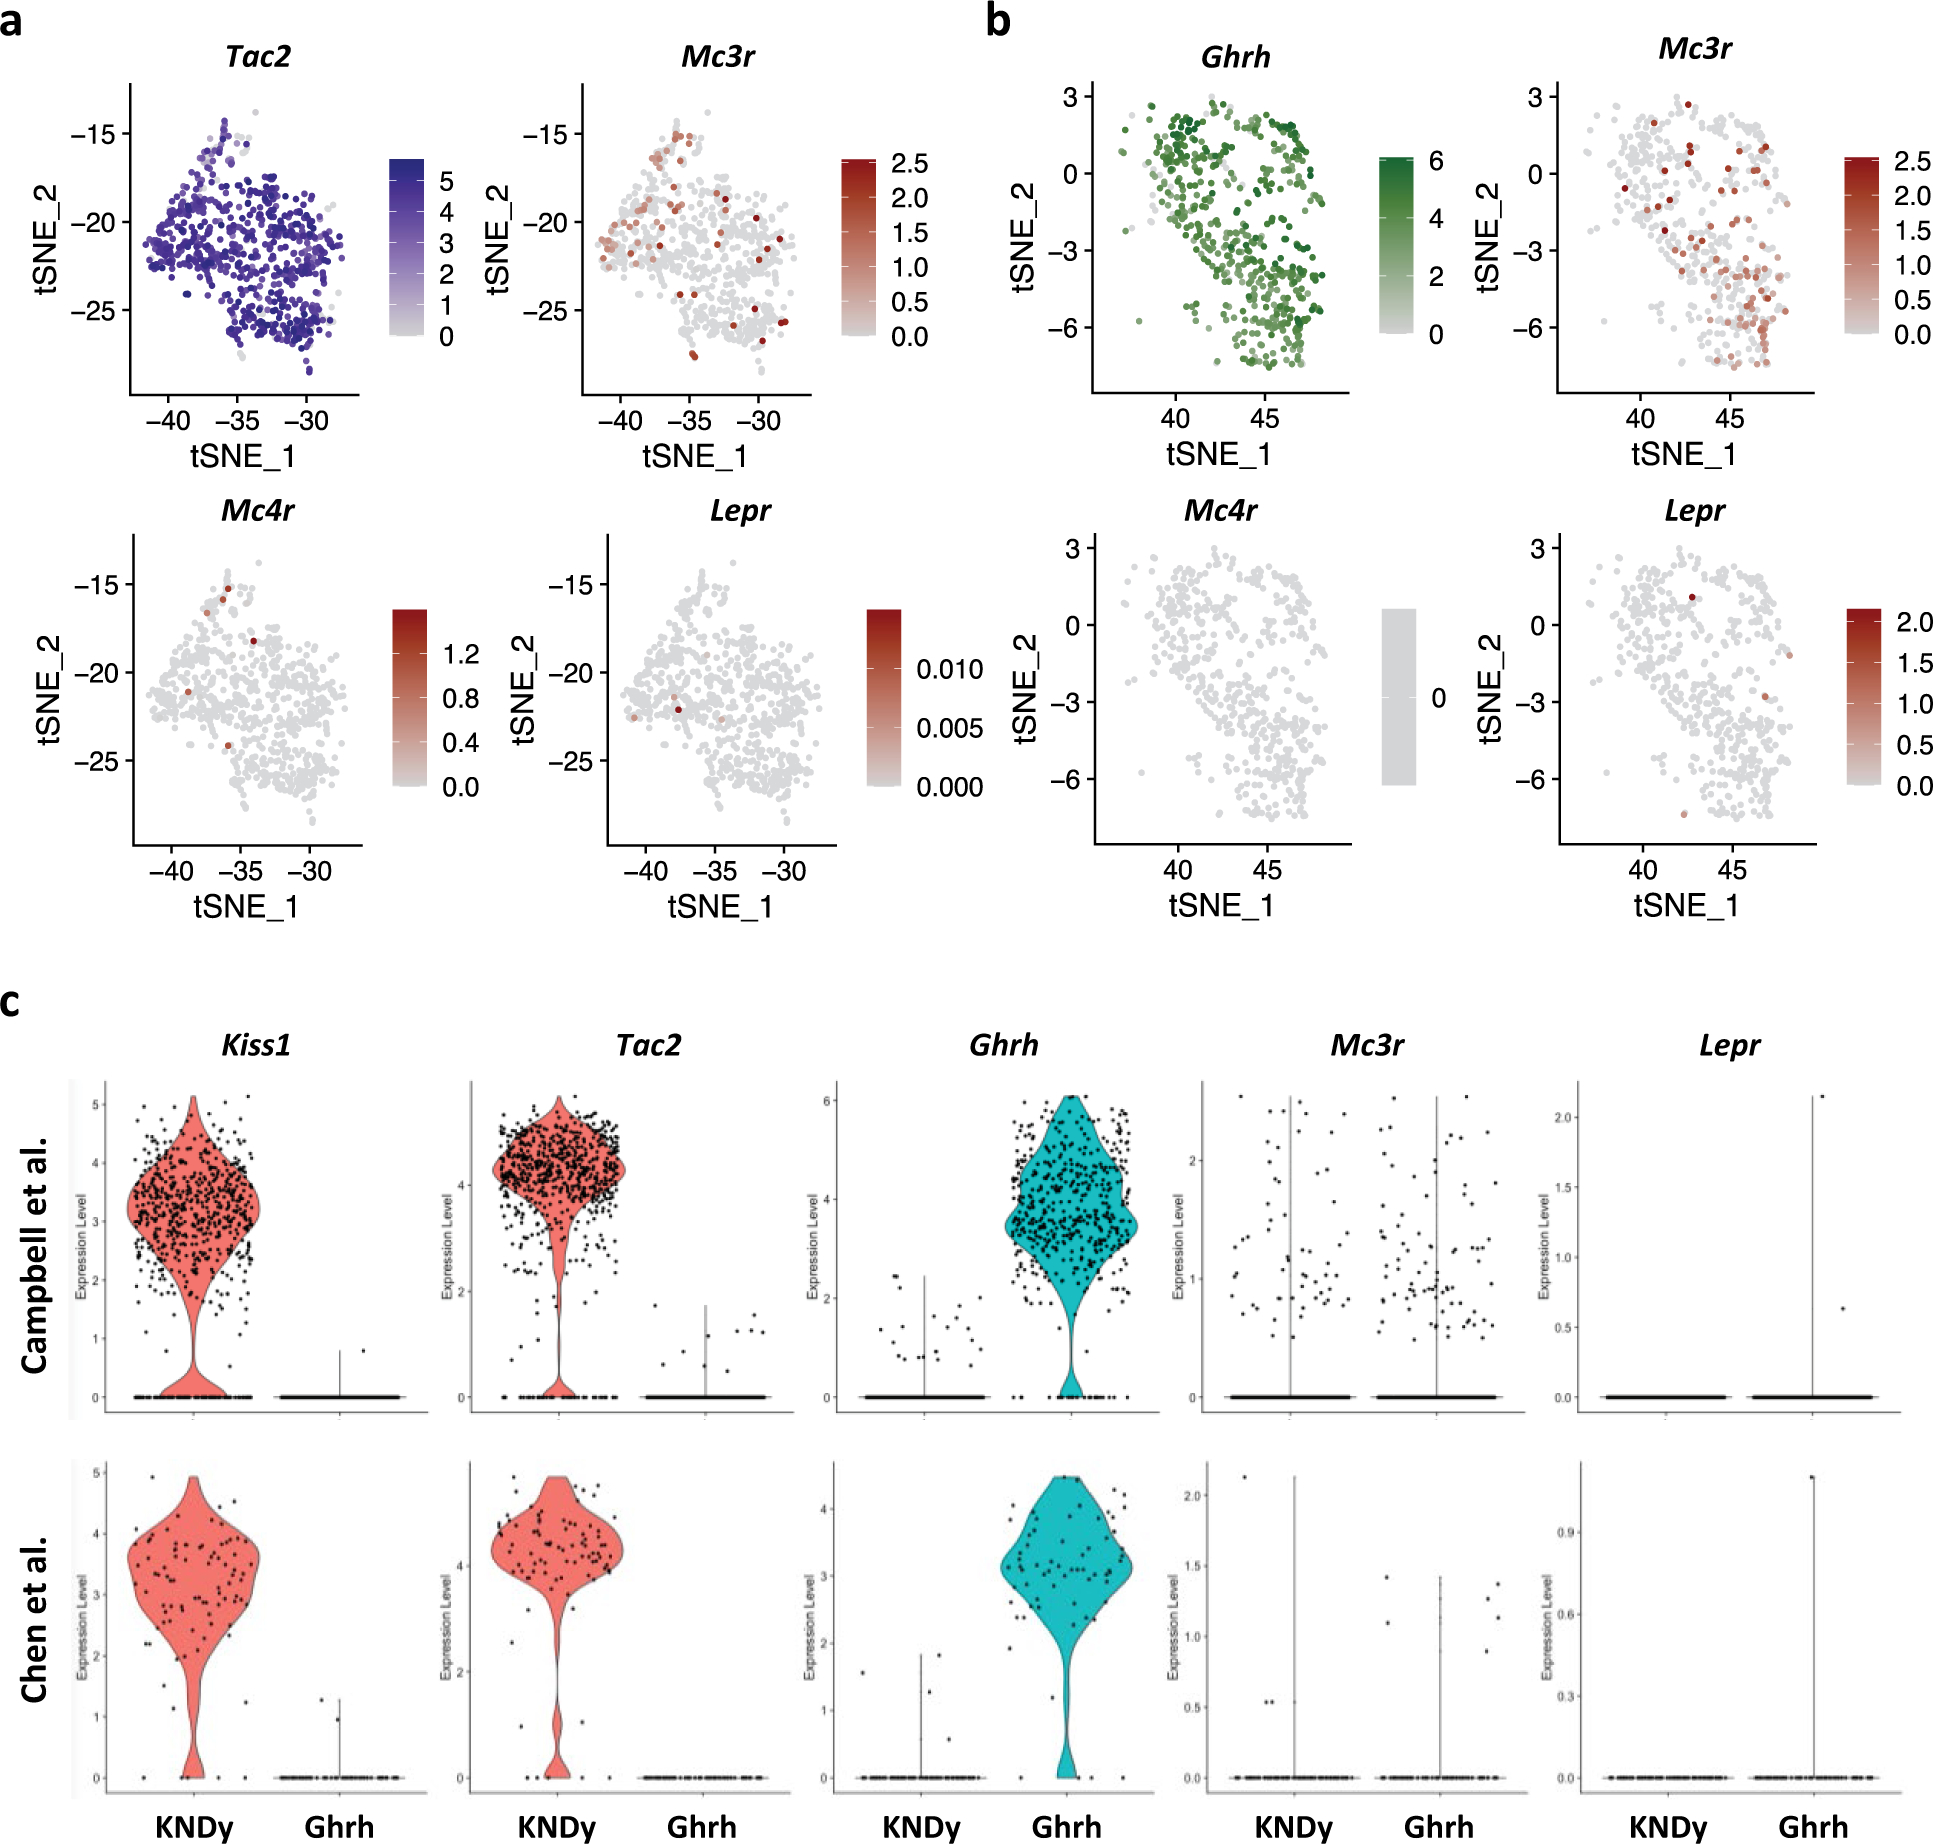
Extended Data Fig. 6 |. Expression of Mc3r and Lepr in KNDy and GHRH neurons.

a, b, Mc3r expression is more prominent compared to Mc4r and Lepr in Tac2 (KNDy) (cluster 7, blue) (a) and GHRH neurons (cluster 15, green) (b). c, Violin plots showing expression of Kiss1, Tac2, Ghrh, Mc3r and Lepr in KNDy and Ghrh neurons in the Campbell38 and the Chen42 dataset separately. The Lam40 and Romanov41 datasets are not shown due to low cell count (<10).
