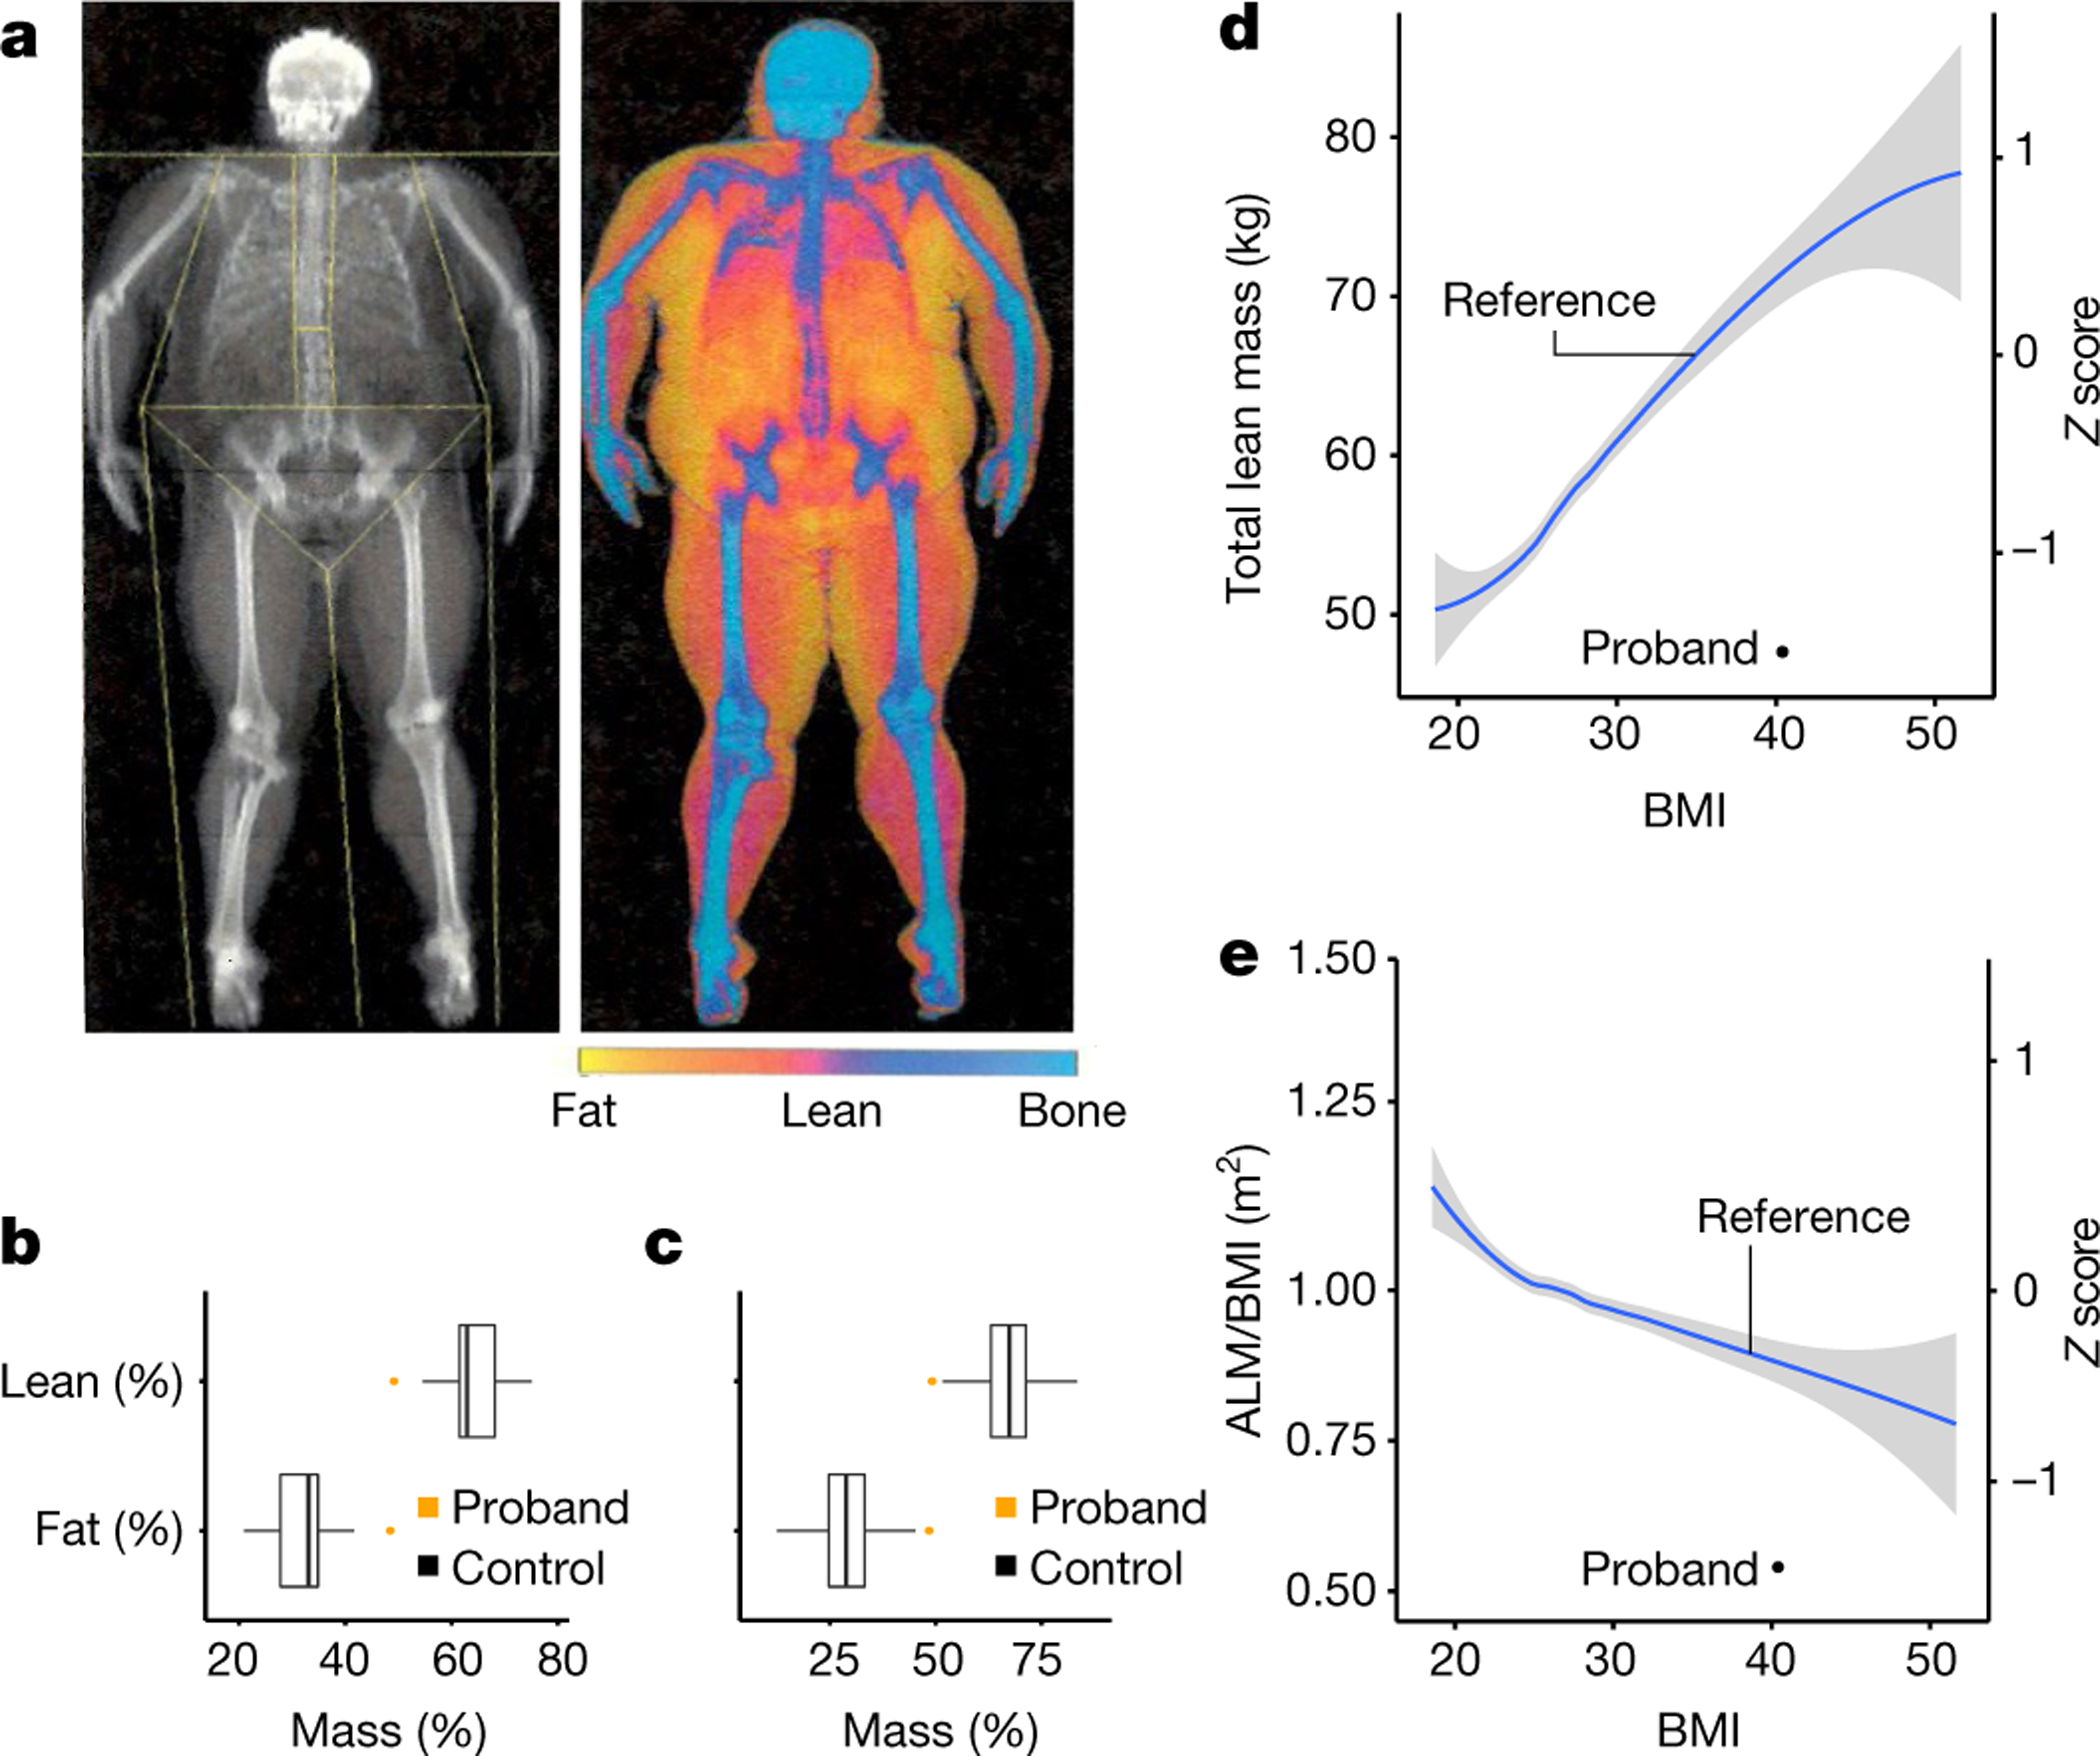
Fig. 2 |. Characteristics of an individual who is homozygous for the MC3R p.G240W mutation.

a, Whole-body dual-energy X-ray absorptiometry image of the MC3R p.G240W proband. b, c, Boxplots of the percentage of fat and lean mass in proband (orange) compared with South Asian men (N = 36) (b) and age-matched European men aged 44–54 years (N = 417) (c) in the UKBB. The centre line indicates the median, the box is the interquartile range, and the whiskers indicate 1.5 times the interquartile range. d, e, The total lean mass (black circle) (d) and the ALM/BMI ratio (e) of the proband compared with men from the UKBB with a BMI from 18 to 52 (the mean is indicated in blue and the grey shading indicates the 95% CI; N = 2,356).
