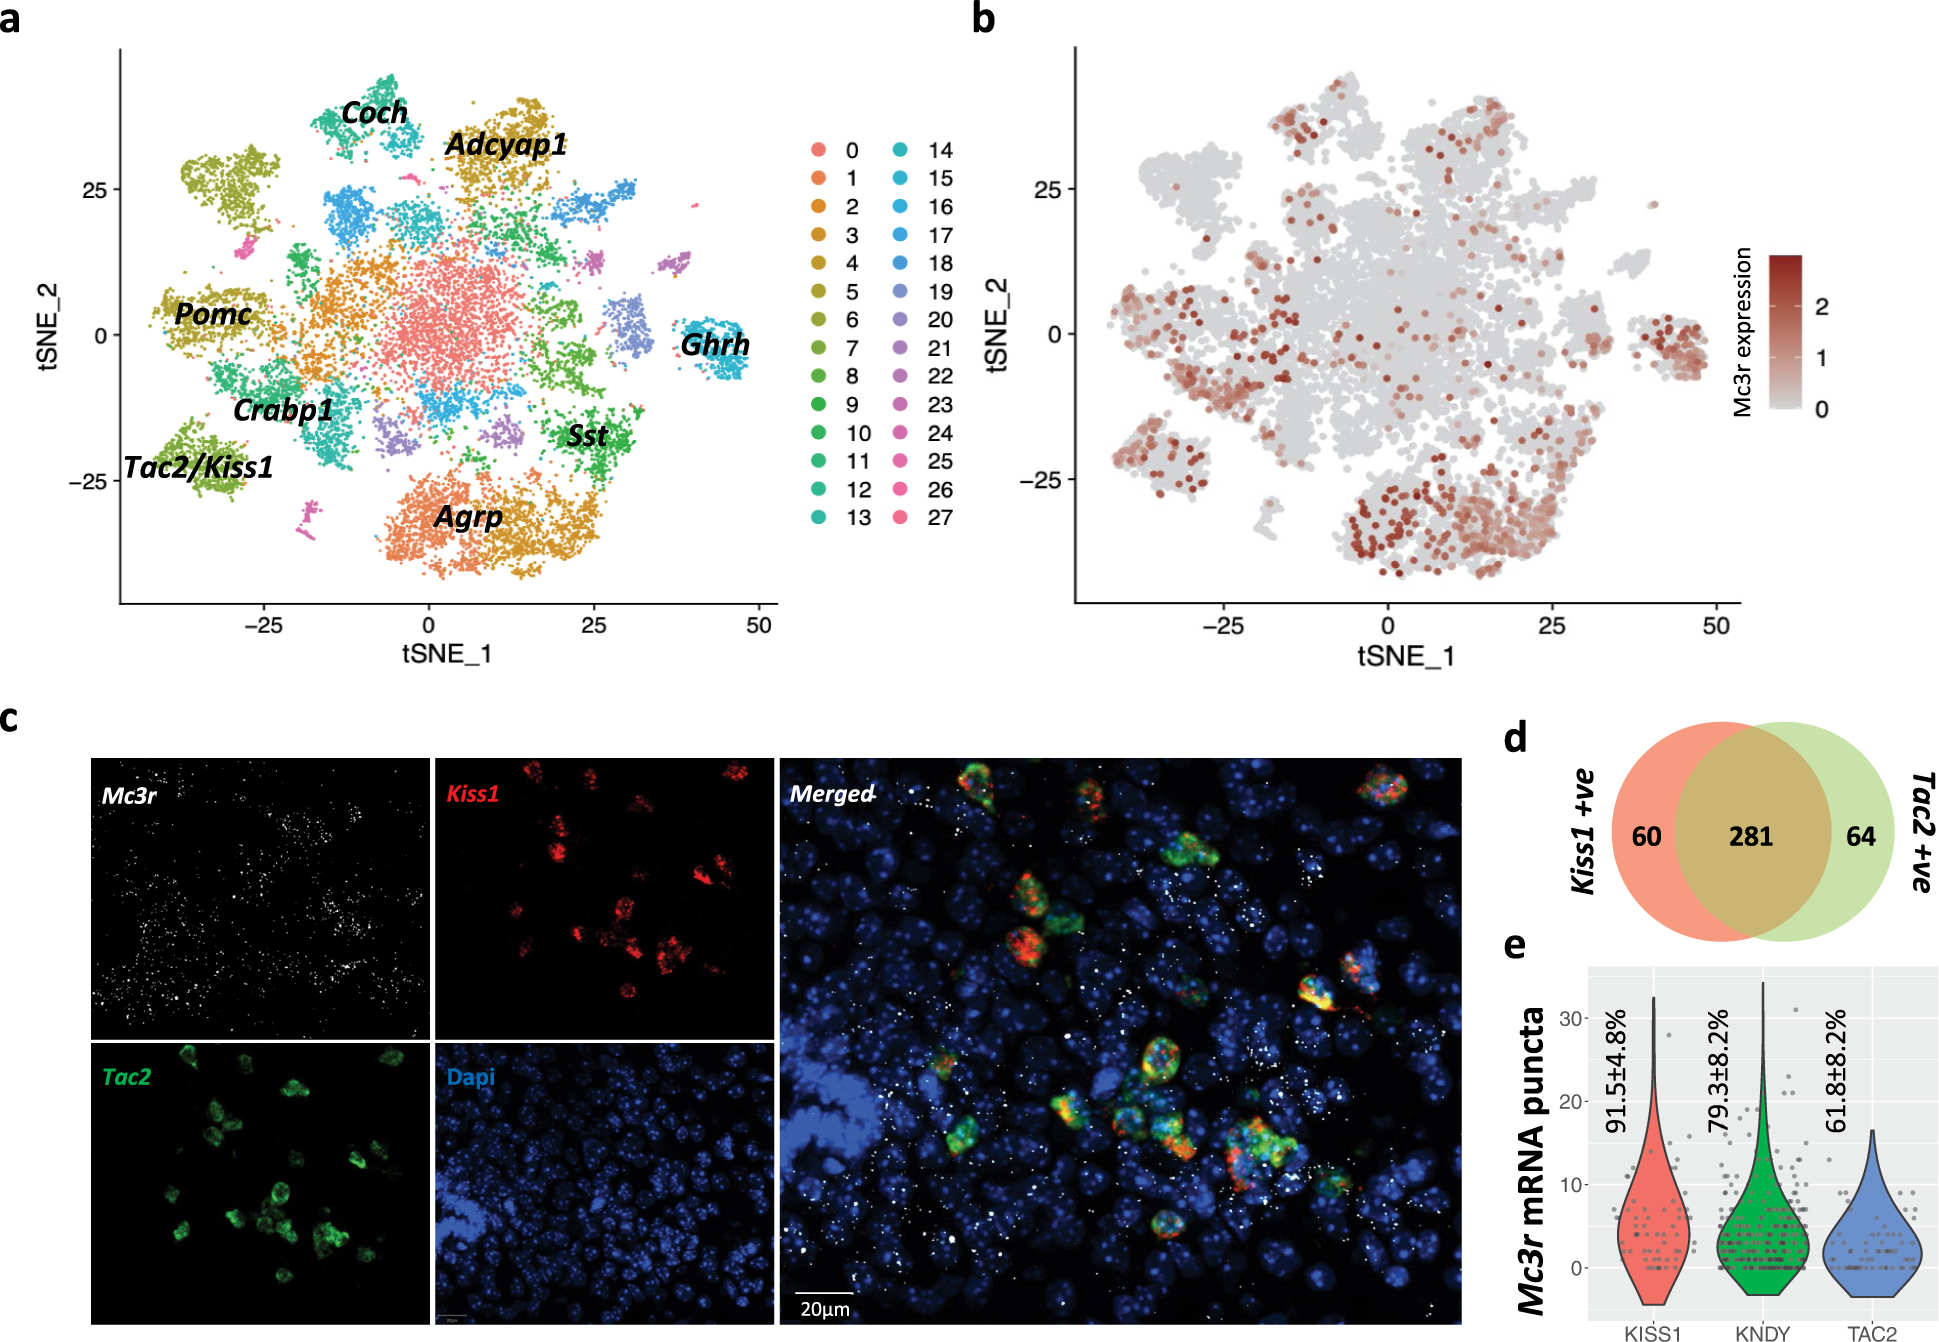
Extended Data Fig. 5 |. Mc3r is expressed in several cell populations in the mouse hypothalamus.

a, T-SNE plot showing 28 neuronal clusters (0–27) of the mouse hypothalamus from a combined dataset consisting of 18,427 neurons from 4 published studies. b, Mc3r is expressed in several neuronal populations (log2 normalised expression in dark red). c, Multiplexed smFISH showing the co-expression of Mc3r (white) Kiss1 (red) and Tac2 (green) in the arcuate nucleus. (Representative example shown, n = 3 mice, scale bar = 20μm). d, Venn diagram showing the number of cells expressing Kiss1 (left, red), Tac2 (right, green), or both (KNDy, centre). e, Violin plots showing the number of Mc3r mRNA punta in Kiss1 only, KNDy, and Tac2 only cells. Mean percentages of cells ± SEM with detected Mc3r are shown, data collected from 3 mice.
