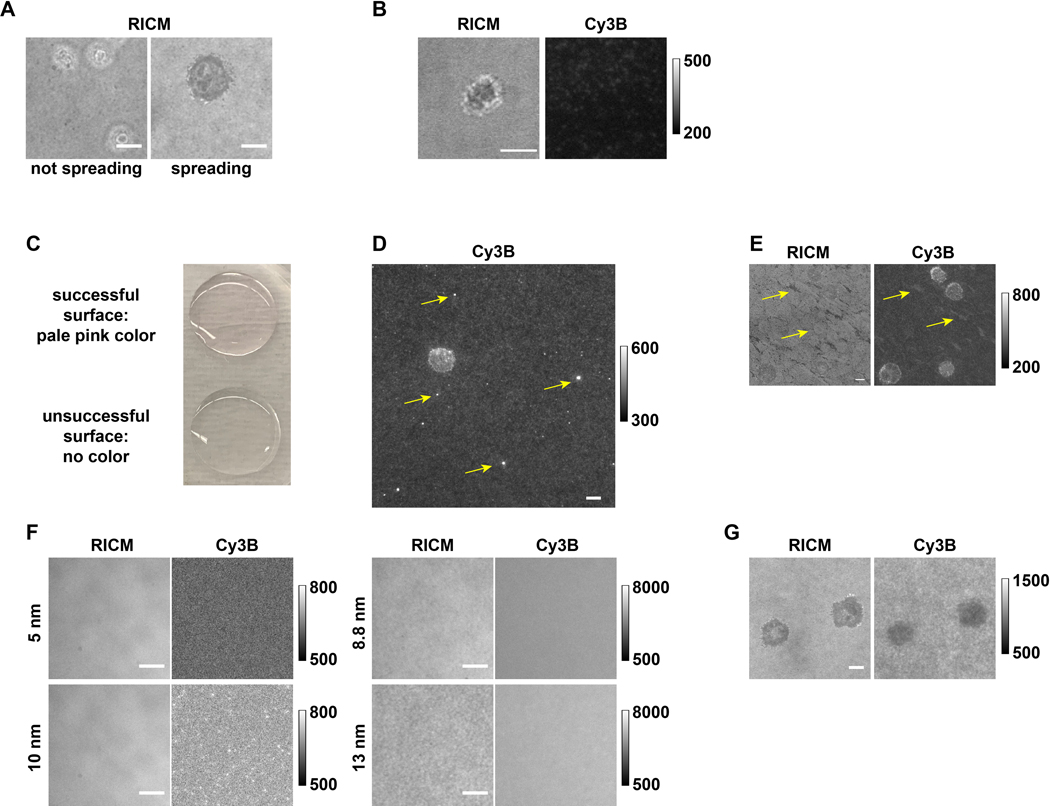
Figure 6.
Examples of successful and unsuccessful surfaces and tension mapping. (A) Cells that do not spread compared to cells that spread on the pMHC N4 surfaces in RICM. (B) OT-1 cell that spread but did not generate any tension signal on an antiCD3ε surface with low DNA tension probe density. (C) Picture showing that the successful surface is pale pink and the unsuccessful surface is colorless. (D) Image in Cy3B channel showing the fluorescent aggregates from an old DNA stock. (E) The pattern in RICM channel and Cy3B channel that is likely due to either insufficient washing or accidental surface drying between steps. (F) Images in RICM and Cy3B channels showing the effect of using Au NPs of different sizes. (G) RICM and Cy3B images of OT-1 cells that did not exert tension signals but instead depleted DNA. Scale bar = 5 μm. Note the raw data shown here was collected by different group members with different image acquisition settings from 3 microscopes, thus having different fluorescence background levels.

