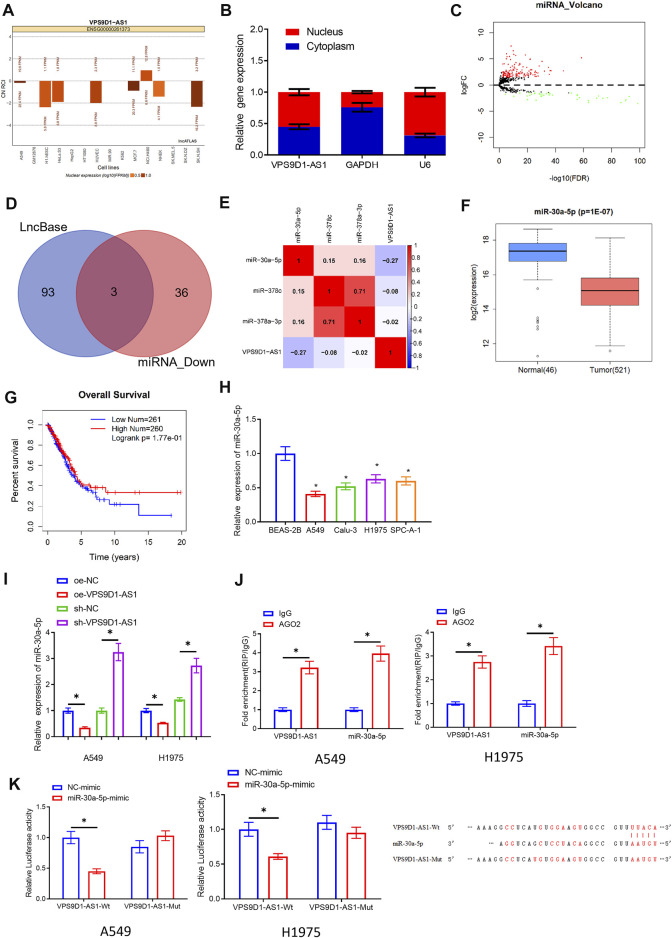
FIGURE 3.
VPS9D1-AS1 can be a molecular sponge for miRNA-30a-5p. (A) LncATLAS database was used for subcellular localization analysis of VPS9D1-AS1. (B) Subcellular fractionation and qRT-PCR were introduced to analyze relative expression of VPS9D1-AS1 in the nuclear and cytoplasmic of A549 cells. (C) Volcano plot of differentially expressed miRNAs in TCGA-LUAD. Red indicates increased miRNAs, and green represents decreased miRNAs. (D) Intersection of miRNAs that have binding sites with VPS9D1-AS1 and differentially downregulated miRNAs in LUAD in LncBase database. (E) The correlation of VPS9D1-AS1, miRNA-30a-5p, miRNA-308c, and miRNA-378a-3p levels in LUAD tissue. (F) Box plot of miRNA-30a-5p level. Blue plot indicates normal tissue, and red plot indicates LUAD tissue. (G) Survival analysis of high- and low-expression groups with the median value of miRNA-30a-5p as the cutoff value. (H) Expression of miRNA-30a-5p in BEAS-2B and A549, Calu-3, H1975, and SPC-A-1 cells (* represents p < 0.05 in comparison with BEAS-2B group). (I) Effect of overexpressing or silencing VPS9D1-AS1 on miRNA-30a-5p level in A549 and H1975 cells (* represents p < 0.05 in comparison with the negative control group). (J) Interaction between VPS9D1-AS1 and miRNA-30a-5p. IgG was a negative control (* represents p < 0.05 in comparison with IgG group). (K) Binding of VPS9D1-AS1 and miRNA-30a-5p (* represents p < 0.05 in comparison with the negative control group). All assays were repeated three times in triplicate.

