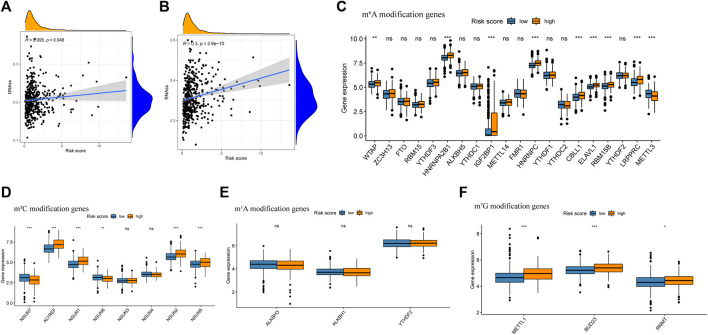
FIGURE 10.
Analysis of risk score with tumor stem cell score and Differential expression of m6A related gene between high risk score group and low risk score group. (A) The relationship between risk score and RNAss. (B) The relationship between risk score and DNAss. (C) Differential expression analysis of m6A related gene between high risk score group and low risk score group. (D) Differential expression analysis of m5C related gene between high risk score group and low risk score group. (E) Differential expression analysis of m1A related gene between high risk score group and low risk score group. (F) Differential expression analysis of m7G related gene between high risk score group and low risk score group.

