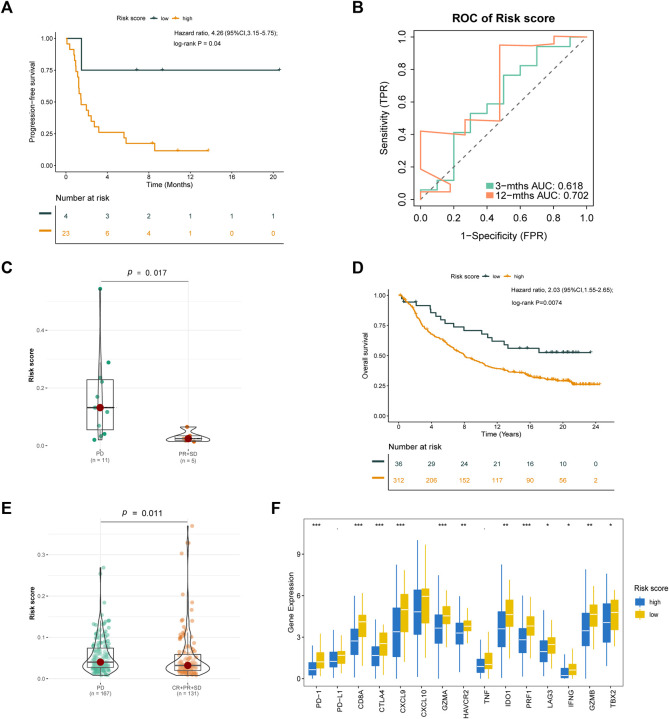
FIGURE 12.
Validation of the risk score formula for immunotherapy. (A) Kaplan-Meier survival curve of GSE135222 cohort for PFS. (B) Time-related ROC analysis proved the prognostic performance of the risk score in the GSE135222. (C) The difference of risk score in the subgroup of PD-1 treatment response in GSE126044. (D) Kaplan-Meier survival curve of IMvigor210 cohort for OS. (E) The difference of Risk score in the subgroup of PD-L1 treatment response. (F) The expression of immue-related checkpoints among high and low risk groups in IMvigor210 cohort. *p < 0.1; *p < 0.05; **p < 0.01; ***p < 0.001.

