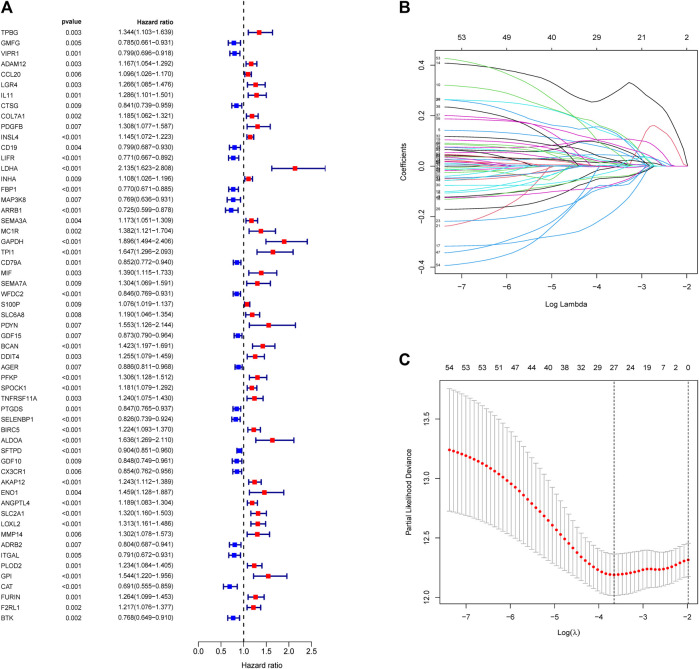
FIGURE 5.
Construction of risk score formula. (A) Forest plots showing the results of survival related gene via univariate Cox regression analysis between interacted genes and OS. (B) LASSO coefficient profile plots of the 57 prognostic related genes showing that the variations in the size of the coefficients of parameters shrink with an increasing value of the k penalty. (C) Penalty plot for the LASSO model for the 57 prognostic genes with error bars denoting the standard errors.

