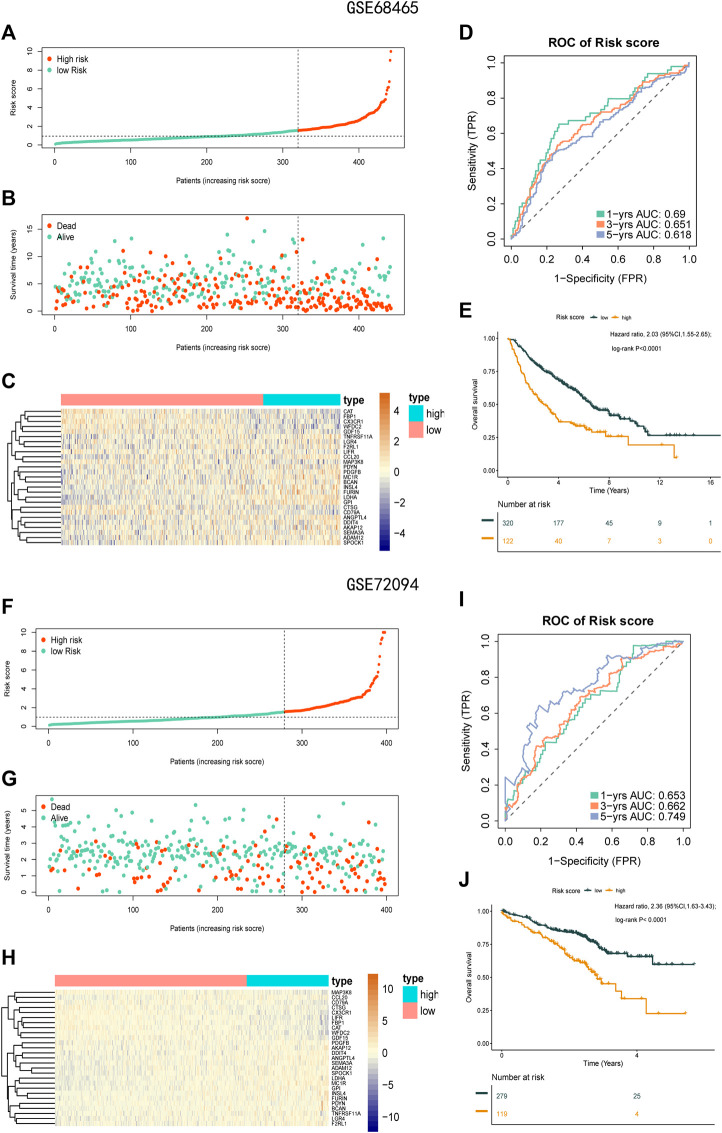
FIGURE 7.
Prognostic analysis of the 27-gene signature model in the validation sets GSE68465 and GSE72094. (A) Distribution of risk score for the GSE68465. (B) Patterns of the survival time and survival status between the high-risk and low-risk groups for GSE68465. (C) Heatmaps of the 27 prognostic genes for each patient in GSE68465. (D) Time-related ROC analysis proved the prognostic performance of the risk score in the GSE68465. (E) Kaplan-Meier survival curve of the patients in the high risk score and low risk score groups for OS in the GSE68465. (F) Distribution of risk score for the GSE72094. (G) Patterns of the survival time and survival status between the high-risk and low-risk groups for GSE72094. (H) Heatmaps of the 27 prognostic genes for each patient in GSE72094. (I) Time-related ROC analysis proved the prognostic performance of the risk score in the GSE72094. (J) Kaplan-Meier survival curve of the patients in the high-risk and low-risk groups for OS in the GSE72094.

