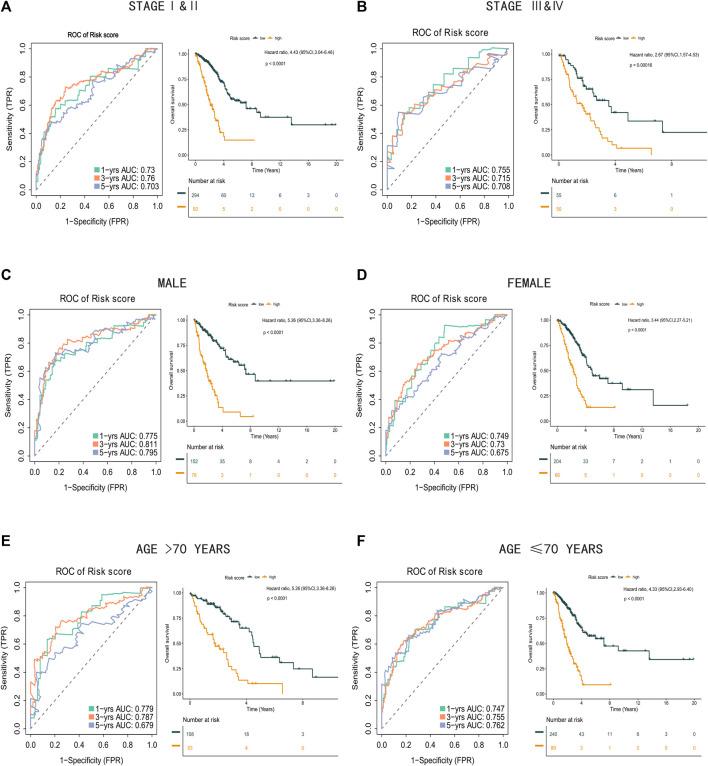
FIGURE 8.
Clinical subgroups analysis between high risk score group and low risk score group. (A) Time-related ROC analysis and Kaplan-Meier survival curve of the patients in stage I and stage II. (B) Time-related ROC analysis and Kaplan-Meier survival curve of the patients in stage III and stage IV. (C) Time-related ROC analysis and Kaplan-Meier survival curve of the male patients. (D) Time-related ROC analysis and Kaplan-Meier survival curve of the female patients. (E) Time-related ROC analysis and Kaplan-Meier survival curve of the patients more than 70 years old. (F) Time-related ROC analysis and Kaplan-Meier survival curve of the patients less than or equal to 70 years old.

