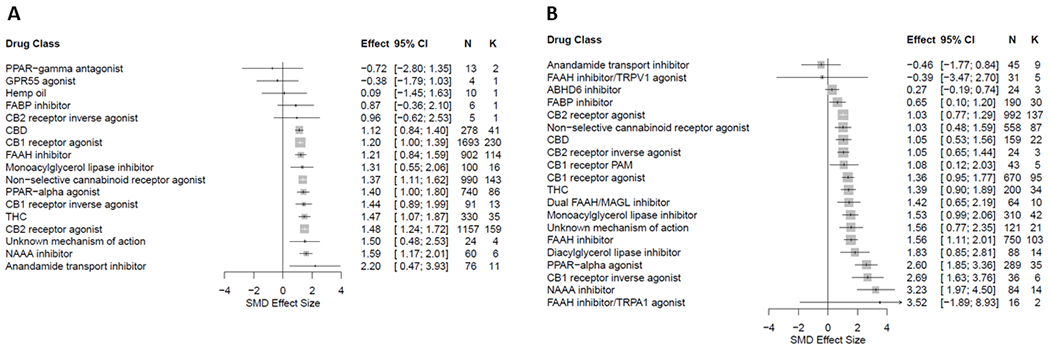
Figure 4.

Forest plot of drug classes assessed for antinociceptive efficacy in rat (A) and mouse (B) models of injury-related or pathological persistent pain. The size of the squares represents the weight (%) and its influence on the pooled result. N denotes the number of animals and K the number of comparisons of each sub-group215.
