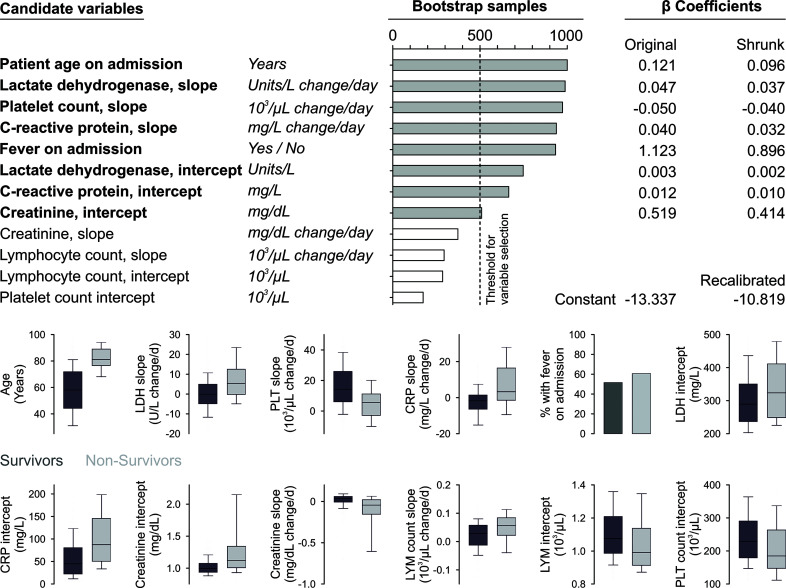
Figure 2.
Model development. Candidate variables in bold were selected as they remained in the model after backward elimination in more than 50% of all bootstrap samples. Coefficients were shrunk according to a linear shrinkage factor, which was 0.7974 (Steyerberg et al., 2001). The constant was recalibrated that the mean estimated mortality probability corresponded to the mortality in the training sample. The boxplots show median, interquartile range as well as 10th and 90th percentile of continuous candidate variables or percentages for fever on admission according to outcome.

