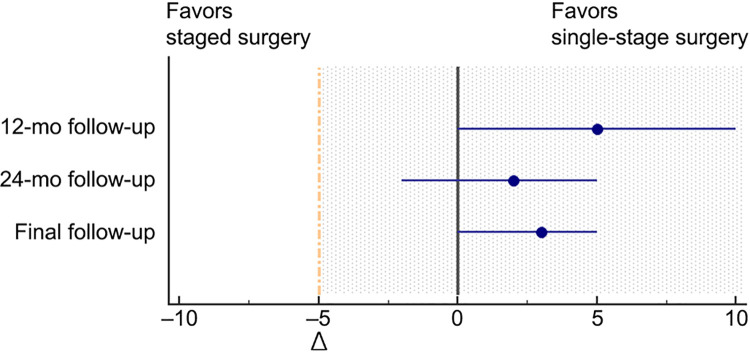
Figure 4.
Interpretation of the between-group difference in Karlsson-Peterson scores at different follow-up times. The blue lines represent the 95% CIs of the median difference (blue dots). Given that the confidence intervals for comparisons at 24-month follow-up are to the right of the noninferiority margin (Δ, −5 points) and also include zero, single-stage surgery was considered noninferior to staged surgery at 24-month follow-up. Dashed yellow line indicates noninferiority margin; shaded region indicates zone of noninferiority.

