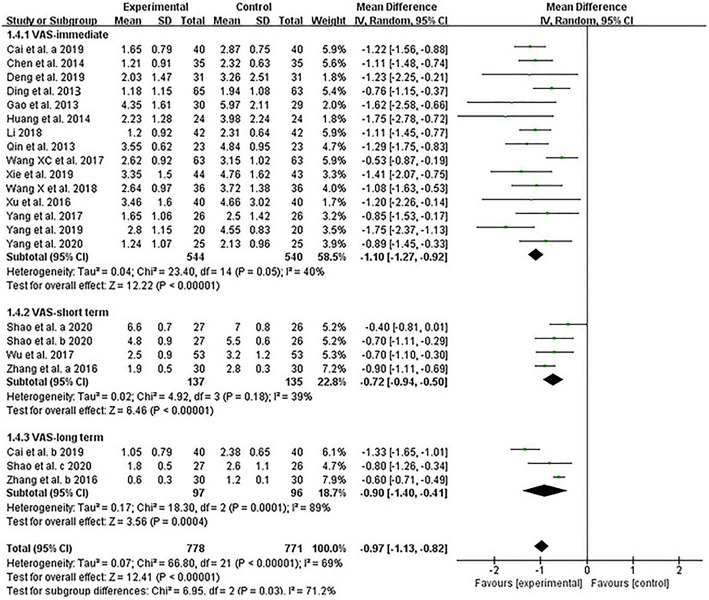
Figure 3.
Forest plot of comparison of visual analog scale (VAS) between extracorporeal shockwave therapy plus routine treatments and routine treatments. Within the figure the three time points were marked as a, b and c, and relate to before treatment, immediately after treatment and 3 months after treatment. IV, Inverse Variance.

