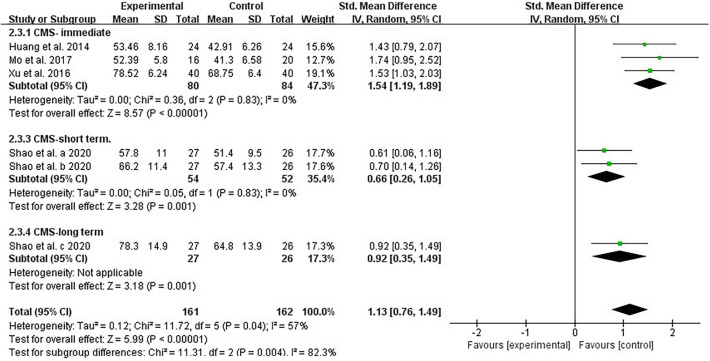
Figure 4.
Forest plot of the comparison of Constant-Murley score (CMS) between extracorporeal shockwave therapy plus routine treatments and routine treatments. Within the figure the three time points were marked as a, b and c, and relate to before treatment, immediately after treatment and 3 months after treatment. IV, Inverse Variance; Std, standardized.

