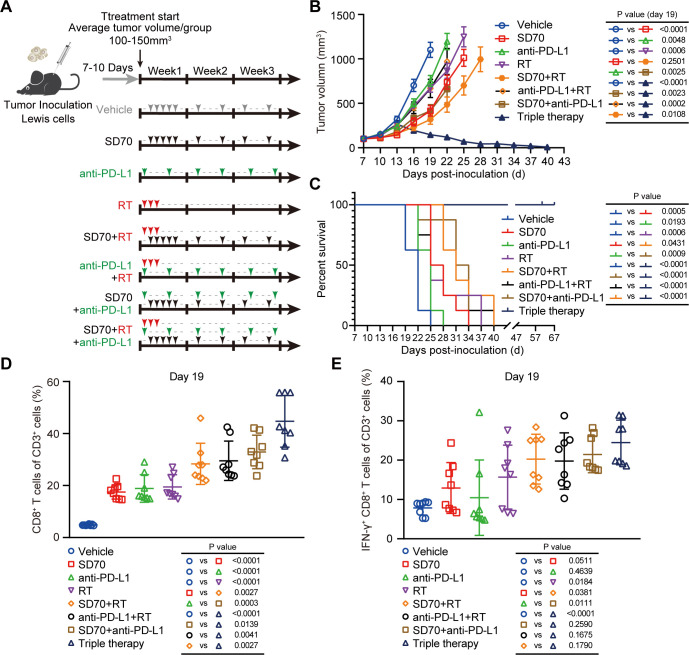
Figure 5.
Triple therapy shows the greatest antitumor effects in lung cancer. (A) Schematic illustration of treatment schedule. (B) A C57BL/6 murine model was established, and the mice were randomly divided into eight groups. Each group was treated according to the schedule shown in (A). All subcutaneously transplanted tumors were measured every 3 days with Vernier calipers. When the subcutaneously transplanted tumors in the group reached 1500 mm3 or more than 60 days had elapsed from tumor cell injection, the experiment was terminated. The tumor growth curves of subcutaneously transplanted tumors were drawn, and the data on the 19th day were statistically analyzed (mean±SEM, n=8/group). (C) Kaplan–Meier analysis across the treatment groups in figure part B. (D, E) Flow cytometry analyses of CD8+ T cells (D) and IFN-γ+ CD8+ T cells (E) in subcutaneously transplanted tumors on day 19 of treatment. P<0.05 was considered statistically significant (n=8/group; two-tailed t-test).

