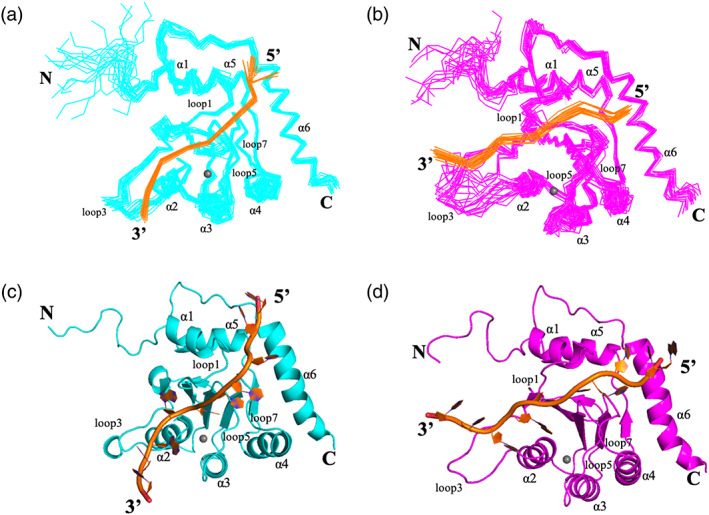
FIGURE 3.

NMR structures of A3A‐TC DNA complexes. (a) The bundle of 20 structures of A3AS‐DNAS complex with the lowest energies. (b) The bundle of 20 structures of A3ANS‐DNANS complex with the lowest energies. (c) One structure of A3AS‐DNAS complex. (d) One structure of A3ANS‐DNANS complex. In (a, b) and (c, d), DNA (in orange) and A3A4M (in cyan or pink) were displayed in ribbon and cartoon modes, respectively. The N‐ and C‐termini, the loops 1, 3, 5 and 7, the helices α1, α2, α3, α4, α5 and α6 of A3A4M, and 5′‐ and 3′‐ ends of DNA were labeled, respectively. The grey balls represented zinc ions
