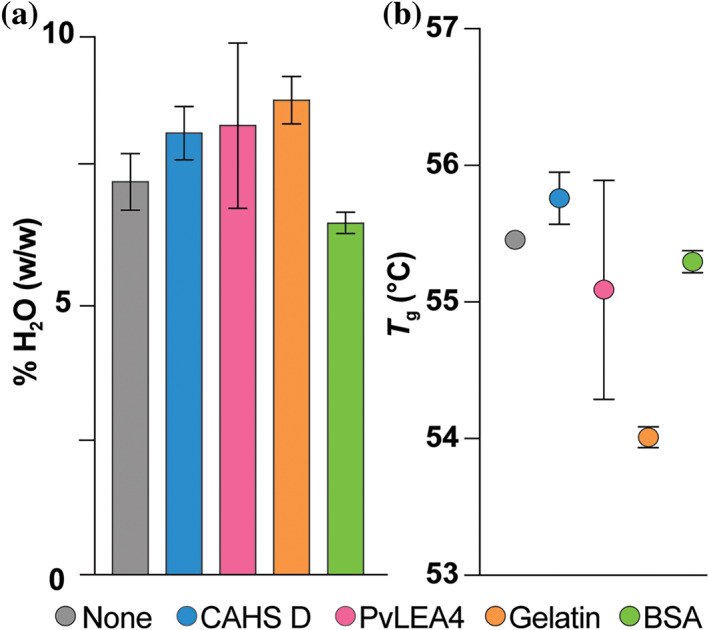
FIGURE 2.

Percent H2O by mass (a) and glass transition temperature (T g) (b) of lyophilized GB1 with indicated protectants. Samples (650 μl) comprising 500 μM (~3 g/L) GB1 alone or with 5 g/L protectant were lyophilized for 24 hr, and immediately analyzed. Uncertainties in %H2O are the standard deviation from three independent measurements for GB1 with CAHS D, four independent measurements for GB1 with PvLEA4, and the range of two independent measurements for other data shown, including T g
