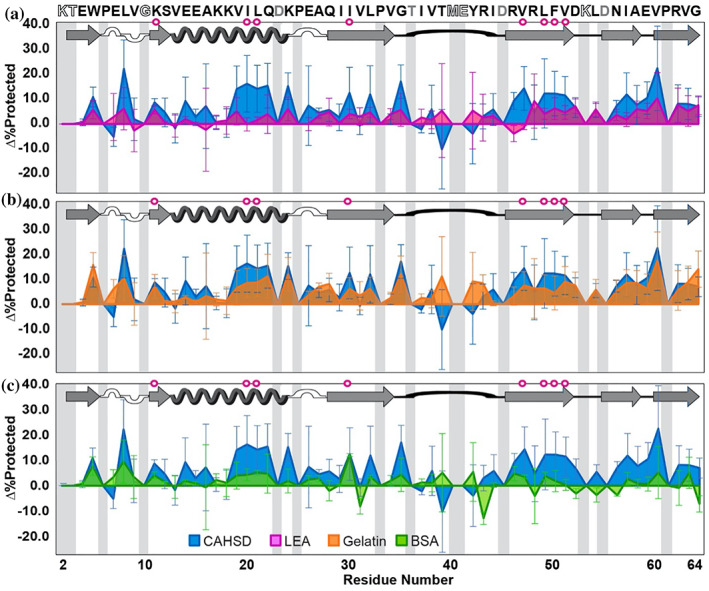
FIGURE 4.

Change in CI2 dry‐state protection due to freeze‐drying in CAHS D versus (a) PvLEA4, (b) gelatin, and (c) BSA. Δ%Protected = %Protected+cosolute − %Protected−cosolute. Primary structure of CI2 (PDB 2CI2) is shown at the top. Secondary structure is shown atop each panel. Magenta circles indicate solution global‐unfolding residues. Gray boxes indicate missing data from rapid back exchange (open letters in primary structure) and/or overlapping crosspeaks (gray letters in primary structure). Error bars represent standard deviations from the mean propagated from triplicate analysis
