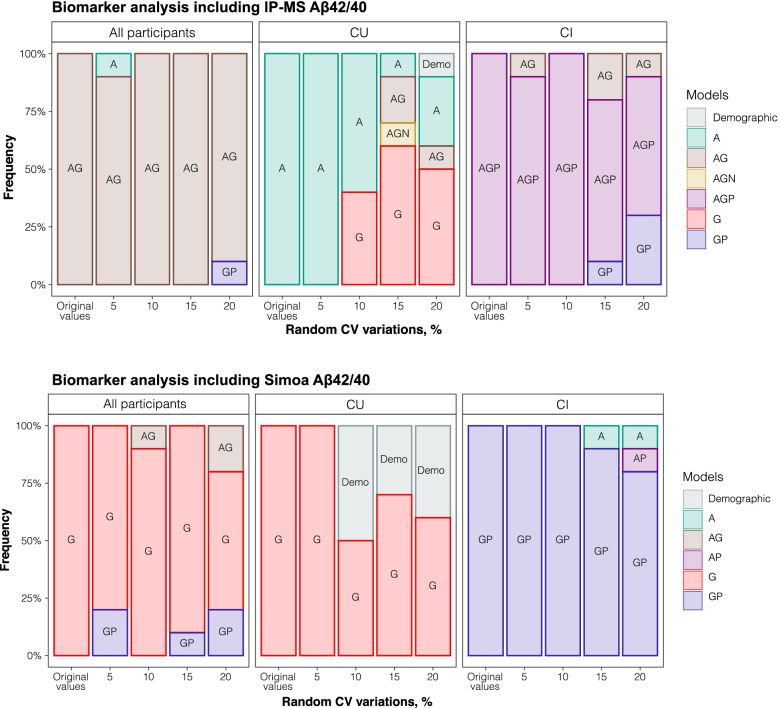
Fig. 3.
Model selection over random variation. Stacked bar chart shows the frequency that each model was selected when random CV variation was generated for each biomarker. The best model selected when using the original biomarker measurements is represented on the “Original values” bar. The following bars represent the frequency that a model was selected as “best model,” at each of the 10 iterations, when random CV variation was created ranging from 5 to 20%. The analysis was performed with all participants, within CU and within CI groups. A, plasma Aβ42/40; AG, plasma Aβ42/40 + GFAP; AGN, plasma Aβ42/40 + GFAP + NfL; AGP, plasma Aβ42/40 + GFAP + p-tau181; AUC, area under the curve; CI, cognitively impaired; CU, cognitively unimpaired; CV, coefficient of variation; G, plasma GFAP; GP, plasma GFAP + p-tau181

