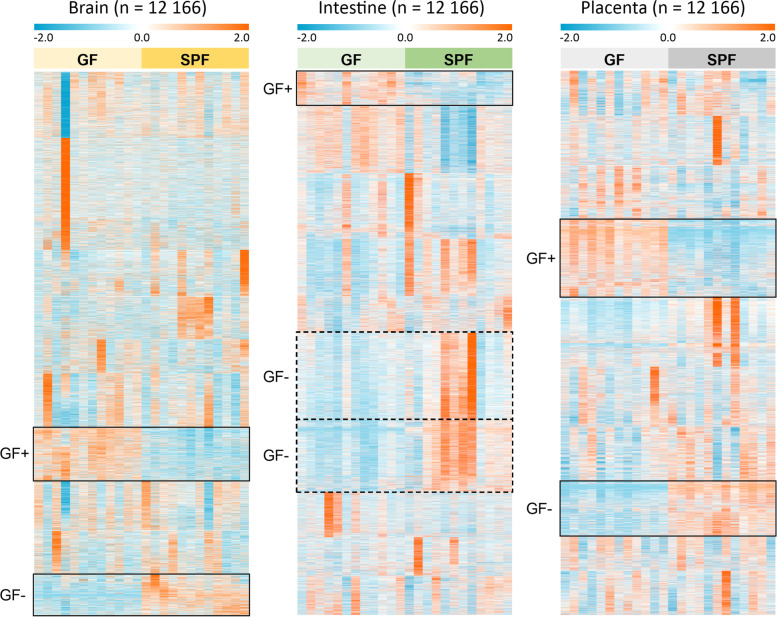
Fig. 3.
Heat map of the normalized abundances of all the signals from the four studied modes (RP+, RP−, HILIC+, HILIC−) after data cleanup (n = 12,166) in the brain, intestinal and placental samples. k-Means clustering (k = 10) was applied to each sample type separately to arrange the metabolites based on their similarity of the abundance between the samples. Clusters with tendency for increased or decreased abundance in the GF (germ-free) mice compared to SPF (specific pathogen free) mice are highlighted (continuous line: consistent trend across all samples, dashed line: trend with high interindividual variability). Individual signals are not aligned throughout all organ samples due to separately performed clustering

