Fig. 4.

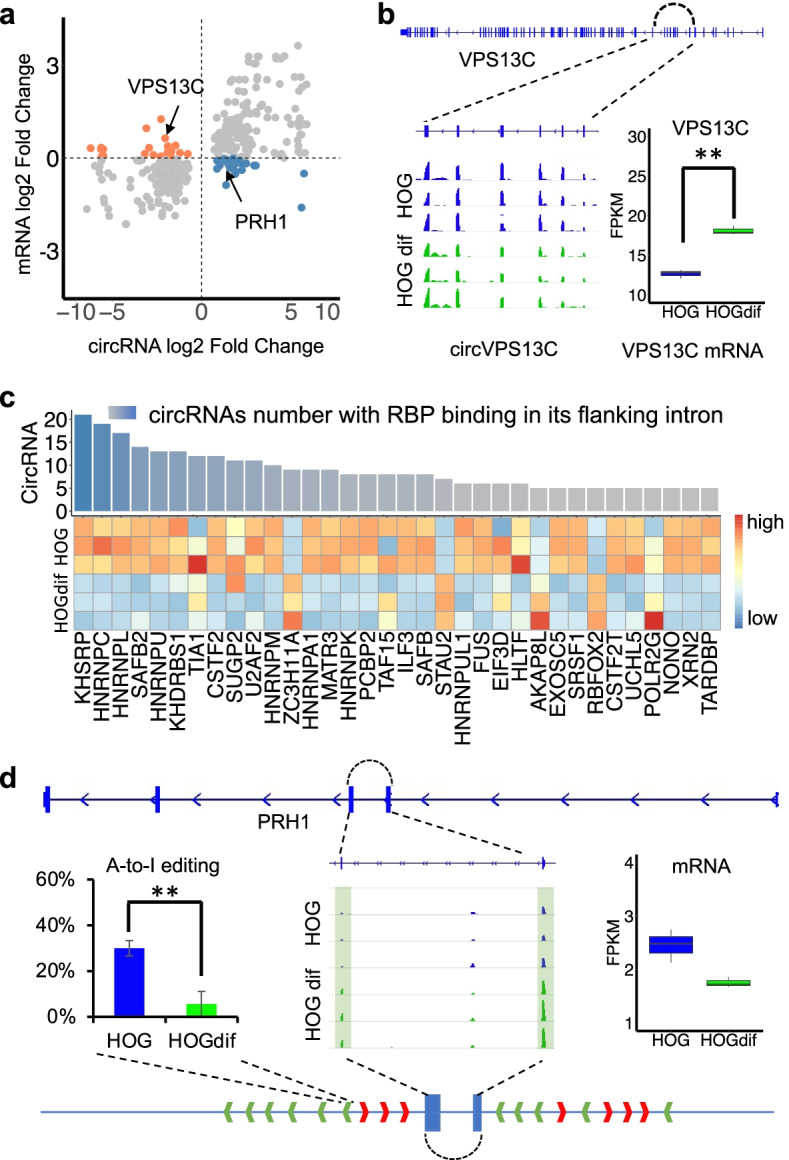
CircRNAs are regulated post-transcriptionally by RBPs and A-to-I editing in their flanking introns upon HOG differentiation. a Scatter plot shows the correlation between log2 fold change of circRNAs and their host gene expression change upon HOG differentiation. Grey dots are positive correlations between circRNAs and their host genes (group 1), while blue and orange dots stand for inversely correlated circRNAs with their host gene (group 2). b IGV view showed circVPS13C was downregulated upon HOG differentiation. Bar plot indicated VPS13C mRNA was upregulated upon HOG differentiation. c Bar plot indicated the number of circRNAs from group 2 in Fig. 4a that a given RNA-binding protein could bind to their flanking introns. Heatmap showed RPKM levels of those RBPs in parental and differentiated HOG cells. d IGV view showed circPRH1 expression was upregulated during HOG differentiation. CircPRH1 full-length sequences are in green. The left bar plot shows that the A-to-I editing in the Alu sequence of circPRH1 flanking introns was depleted upon HOG differentiation. The right bar plot shows that PRH1 mRNA was downregulated upon HOG differentiation. Student’s t-test (two-tailed and unpaired) was used for A-to-I editing change. **P < 0.01
