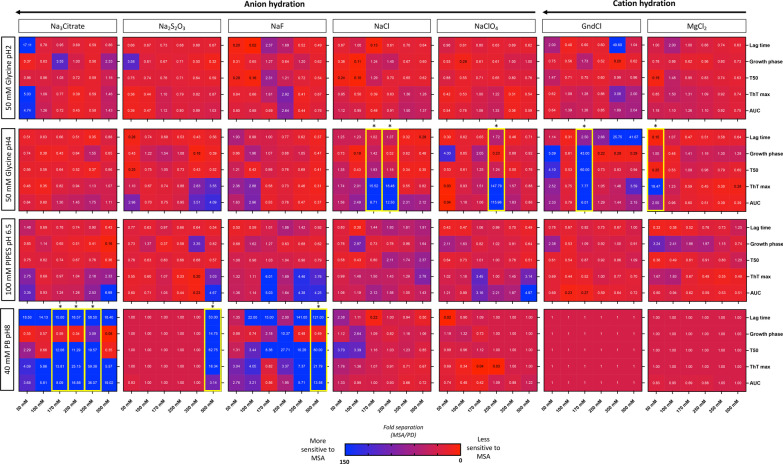
Fig. 3.
Changes in RT-QuIC physicochemical factors promote the detection of α-synuclein seeding in MSA. Fold separation of lag time, growth phase, T50, ThT max, and area under the curve (AUC) between reactions seeded with MSA- or PD-derived α-synuclein aggregates and amplified under 4 different pH using 7 salts at 6 concentrations. Larger numbers (blue) represent the conditions that showed a more favorable environment to detect MSA α-synuclein aggregation. When the fold separation is 1 (deep red), no discrimination between MSA and PD aggregation was found. Lower numbers (< 1, lighter red/purple) represent the conditions more favorable for detection of PD aggregation over MSA. *Buffers highlighted in yellow boxes represent the optimal conditions to detect α-synuclein seeding in MSA and discriminate MSA from PD

