
Table 1.
Demographics of analytic sample at Wave 3 (N = 317)
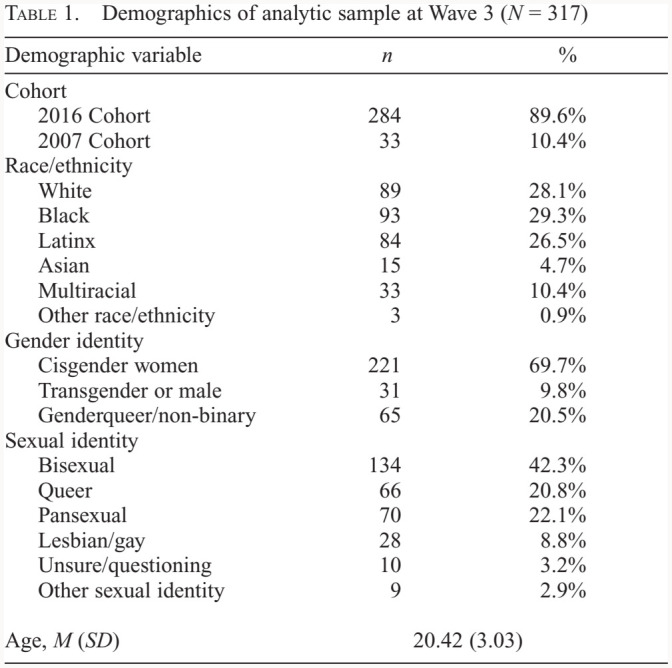
| Demographic variable | n | % |
|---|---|---|
| Cohort | ||
| 2016 Cohort | 284 | 89.6% |
| 2007 Cohort | 33 | 10.4% |
| Race/ethnicity | ||
| White | 89 | 28.1% |
| Black | 93 | 29.3% |
| Latinx | 84 | 26.5% |
| Asian | 15 | 4.7% |
| Multiracial | 33 | 10.4% |
| Other race/ethnicity | 3 | 0.9% |
| Gender identity | ||
| Cisgender women | 221 | 69.7% |
| Transgender or male | 31 | 9.8% |
| Genderqueer/non-binary | 65 | 20.5% |
| Sexual identity | ||
| Bisexual | 134 | 42.3% |
| Queer | 66 | 20.8% |
| Pansexual | 70 | 22.1% |
| Lesbian/gay | 28 | 8.8% |
| Unsure/questioning | 10 | 3.2% |
| Other sexual identity | 9 | 2.9% |
| Age, M (SD) | 20.42 (3.03) | |