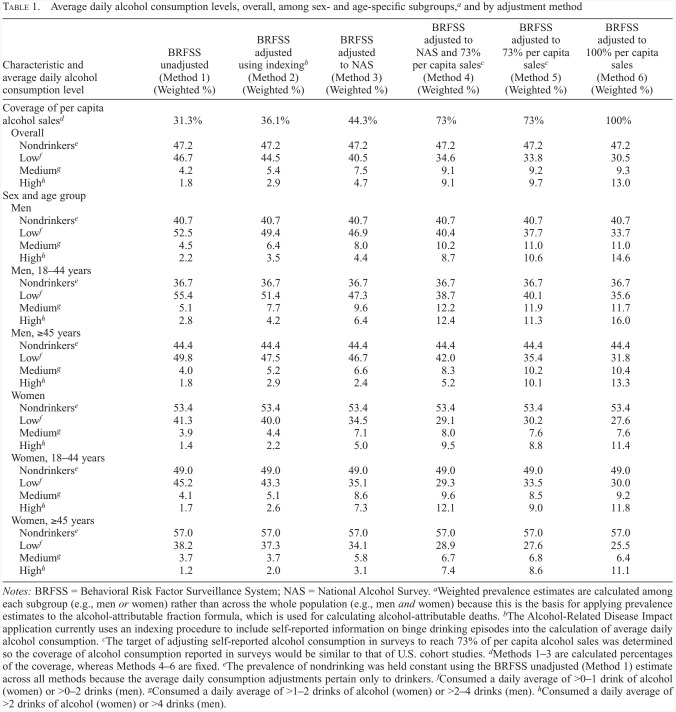
Table 1.
Average daily alcohol consumption levels, overall, among sex- and age-specific subgroups,a and by adjustment method
| Characteristic and average daily alcohol consumption level | BRFSS unadjusted (Method 1) (Weighted %) | BRFSS adjusted using indexingb (Method 2) (Weighted %) | BRFSS adjusted to NAS (Method 3) (Weighted %) | BRFSS adjusted to NAS and 73% per capita salesc (Method 4) (Weighted %) | BRFSS adjusted to 73% per capita salesc (Method 5) (Weighted %) | BRFSS adjusted to 100% per capita sales (Method 6) (Weighted %) |
|---|---|---|---|---|---|---|
| Coverage of per capita alcohol salesd | 31.3% | 36.1% | 44.3% | 73% | 73% | 100% |
| Overall | ||||||
| Nondrinkerse | 47.2 | 47.2 | 47.2 | 47.2 | 47.2 | 47.2 |
| Lowf | 46.7 | 44.5 | 40.5 | 34.6 | 33.8 | 30.5 |
| Mediumg | 4.2 | 5.4 | 7.5 | 9.1 | 9.2 | 9.3 |
| Highh | 1.8 | 2.9 | 4.7 | 9.1 | 9.7 | 13.0 |
| Sex and age group | ||||||
| Men | ||||||
| Nondrinkerse | 40.7 | 40.7 | 40.7 | 40.7 | 40.7 | 40.7 |
| Lowf | 52.5 | 49.4 | 46.9 | 40.4 | 37.7 | 33.7 |
| Mediumg | 4.5 | 6.4 | 8.0 | 10.2 | 11.0 | 11.0 |
| Highh | 2.2 | 3.5 | 4.4 | 8.7 | 10.6 | 14.6 |
| Men, 18-44 years | ||||||
| Nondrinkerse | 36.7 | 36.7 | 36.7 | 36.7 | 36.7 | 36.7 |
| Lowf | 55.4 | 51.4 | 47.3 | 38.7 | 40.1 | 35.6 |
| Mediumg | 5.1 | 7.7 | 9.6 | 12.2 | 11.9 | 11.7 |
| Highh | 2.8 | 4.2 | 6.4 | 12.4 | 11.3 | 16.0 |
| Men, >45 years | ||||||
| Nondrinkerse | 44.4 | 44.4 | 44.4 | 44.4 | 44.4 | 44.4 |
| Lowf | 49.8 | 47.5 | 46.7 | 42.0 | 35.4 | 31.8 |
| Mediumg | 4.0 | 5.2 | 6.6 | 8.3 | 10.2 | 10.4 |
| Highh | 1.8 | 2.9 | 2.4 | 5.2 | 10.1 | 13.3 |
| Women | ||||||
| Nondrinkerse | 53.4 | 53.4 | 53.4 | 53.4 | 53.4 | 53.4 |
| Lowf | 41.3 | 40.0 | 34.5 | 29.1 | 30.2 | 27.6 |
| Mediumg | 3.9 | 4.4 | 7.1 | 8.0 | 7.6 | 7.6 |
| Highh | 1.4 | 2.2 | 5.0 | 9.5 | 8.8 | 11.4 |
| Women, 18-44 years | ||||||
| Nondrinkerse | 49.0 | 49.0 | 49.0 | 49.0 | 49.0 | 49.0 |
| Lowf | 45.2 | 43.3 | 35.1 | 29.3 | 33.5 | 30.0 |
| Mediumg | 4.1 | 5.1 | 8.6 | 9.6 | 8.5 | 9.2 |
| Highh | 1.7 | 2.6 | 7.3 | 12.1 | 9.0 | 11.8 |
| Women, >45 years | ||||||
| Nondrinkerse | 57.0 | 57.0 | 57.0 | 57.0 | 57.0 | 57.0 |
| Lowf | 38.2 | 37.3 | 34.1 | 28.9 | 27.6 | 25.5 |
| Mediumg | 3.7 | 3.7 | 5.8 | 6.7 | 6.8 | 6.4 |
| Highh | 1.2 | 2.0 | 3.1 | 7.4 | 8.6 | 11.1 |
Notes: BRFSS = Behavioral Risk Factor Surveillance System; NAS = National Alcohol Survey.
Weighted prevalence estimates are calculated among each subgroup (e.g., men or women) rather than across the whole population (e.g., men and women) because this is the basis for applying prevalence estimates to the alcohol-attributable fraction formula, which is used for calculating alcohol-attributable deaths.
The Alcohol-Related Disease Impact application currently uses an indexing procedure to include self-reported information on binge drinking episodes into the calculation of average daily alcohol consumption.
The target of adjusting self-reported alcohol consumption in surveys to reach 73% of per capita alcohol sales was determined so the coverage of alcohol consumption reported in surveys would be similar to that of U.S. cohort studies.
Methods 1–3 are calculated percentages of the coverage, whereas Methods 4–6 are fixed.
The prevalence of nondrinking was held constant using the BRFSS unadjusted (Method 1) estimate across all methods because the average daily consumption adjustments pertain only to drinkers.
Consumed a daily average of >0–1 drink of alcohol (women) or >0–2 drinks (men).
Consumed a daily average of >1–2 drinks of alcohol (women) or >2–4 drinks (men).
Consumed a daily average of >2 drinks of alcohol (women) or >4 drinks (men).

