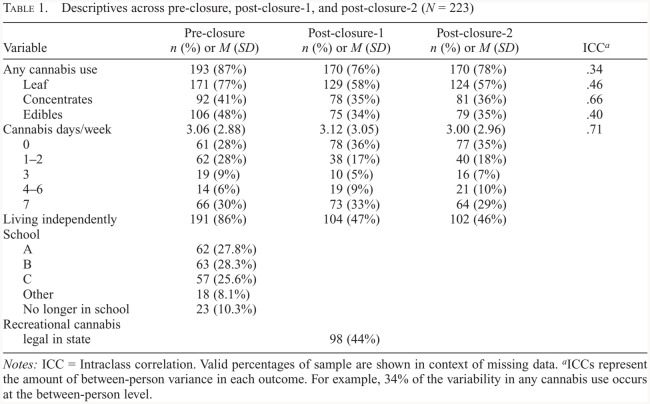
Table 1.
Descriptives across pre-closure, post-closure-1, and post-closure-2 (N = 223)
| Variable | Pre-closure n (%)or M (SD) | Post-closure-1 n (%) or M (SD) | Post-closure-2 n (%) or M (SD) | ICCa |
|---|---|---|---|---|
| Any cannabis use | 193 (87%) | 170 (76%) | 170 (78%) | .34 |
| Leaf | 171 (77%) | 129 (58%) | 124 (57%) | .46 |
| Concentrates | 92 (41%) | 78 (35%) | 81 (36%) | .66 |
| Edibles | 106 (48%) | 75 (34%) | 79 (35%) | .40 |
| Cannabis days/week | 3.06 (2.88) | 3.12 (3.05) | 3.00 (2.96) | .71 |
| 0 | 61 (28%) | 78 (36%) | 77 (35%) | |
| 1-2 | 62 (28%) | 38 (17%) | 40(18%) | |
| 3 | 19 (9%) | 10 (5%) | 16(7%) | |
| 4-6 | 14 (6%) | 19 (9%) | 21 (10%) | |
| 7 | 66 (30%) | 73 (33%) | 64 (29%) | |
| Living independently School | 191 (86%) | 104 (47%) | 102 (46%) | |
| A | 62 (27.8%) | |||
| B | 63 (28.3%) | |||
| C | 57 (25.6%) | |||
| Other | 18(8.1%) | |||
| No longer in school | 23 (10.3%) | |||
| Recreational cannabis legal in state | 98 (44%) |
Notes: ICC = Intraclass correlation. Valid percentages of sample are shown in context of missing data.
ICCs represent the amount of between-person variance in each outcome. For example, 34% of the variability in any cannabis use occurs at the between-person level.

