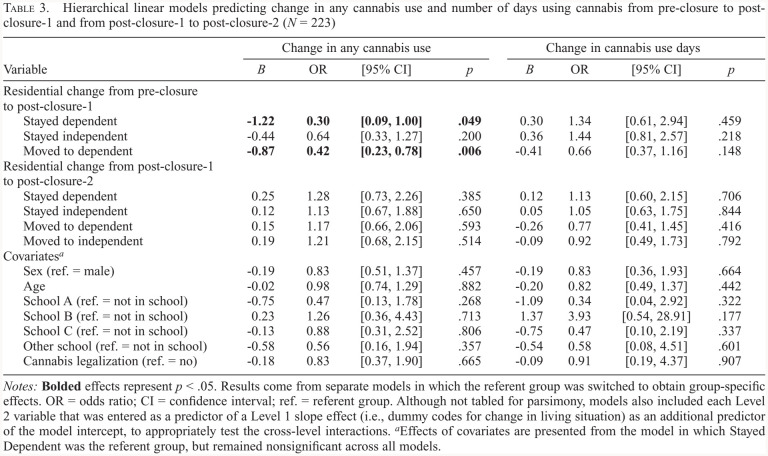
Table 3.
Hierarchical linear models predicting change in any cannabis use and number of days using cannabis from pre-closure to post-closure-1 and from post-closure-1 to post-closure-2 (N = 223)
| Variable | Change in any cannabis use | Change in cannabis use days | ||||||
|---|---|---|---|---|---|---|---|---|
| B | OR | [95% CI] | P | B | OR | [95% CI] | P | |
| Residential change from pre-closure to post-closure-1 | ||||||||
| Stayed dependent | −1.22 | 0.30 | [0.09,1.00] | .049 | 0.30 | 1.34 | [0.61, 2.94] | .459 |
| Stayed independent | −0.44 | 0.64 | [0.33, 1.27] | .200 | 0.36 | 1.44 | [0.81, 2.57] | .218 |
| Moved to dependent | −0.87 | 0.42 | [0.23, 0.78] | .006 | −0.41 | 0.66 | [0.37, 1.16] | .148 |
| Residential change from post-closure-1 to post-closure-2 | ||||||||
| Stayed dependent | 0.25 | 1.28 | [0.73, 2.26] | .385 | 0.12 | 1.13 | [0.60, 2.15] | .706 |
| Stayed independent | 0.12 | 1.13 | [0.67, 1.88] | .650 | 0.05 | 1.05 | [0.63, 1.75] | .844 |
| Moved to dependent | 0.15 | 1.17 | [0.66, 2.06] | .593 | −0.26 | 0.77 | [0.41, 1.45] | .416 |
| Moved to independent | 0.19 | 1.21 | [0.68, 2.15] | .514 | −0.09 | 0.92 | [0.49, 1.73] | .792 |
| Covariatesa | ||||||||
| Sex (ref. = male) | −0.19 | 0.83 | [0.51, 1.37] | .457 | −0.19 | 0.83 | [0.36, 1.93] | .664 |
| Age | −0.02 | 0.98 | [0.74, 1.29] | .882 | −0.20 | 0.82 | [0.49, 1.37] | .442 |
| School A (ref. = not in school) | −0.75 | 0.47 | [0.13, 1.78] | .268 | −1.09 | 0.34 | [0.04, 2.92] | .322 |
| School B (ref. = not in school) | 0.23 | 1.26 | [0.36, 4.43] | .713 | 1.37 | 3.93 | [0.54, 28.91] | .177 |
| School C (ref. = not in school) | −0.13 | 0.88 | [0.31, 2.52] | .806 | −0.75 | 0.47 | [0.10, 2.19] | .337 |
| Other school (ref. = not in school) | −0.58 | 0.56 | [0.16, 1.94] | .357 | −0.54 | 0.58 | [0.08, 4.51] | .601 |
| Cannabis legalization (ref. = no) | −0.18 | 0.83 | [0.37, 1.90] | .665 | −0.09 | 0.91 | [0.19, 4.37] | .907 |
Notes: Bolded effects represent p < .05. Results come from separate models in which the referent group was switched to obtain group-specific effects. OR = odds ratio; CI = confidence interval; ref. = referent group. Although not tabled for parsimony, models also included each Level 2 variable that was entered as a predictor of a Level 1 slope effect (i.e., dummy codes for change in living situation) as an additional predictor of the model intercept, to appropriately test the cross-level interactions.
Effects of covariates are presented from the model in which Stayed Dependent was the referent group, but remained nonsignificant across all models.

